| Model Fitting: Linear Regression |
The Tables Tab
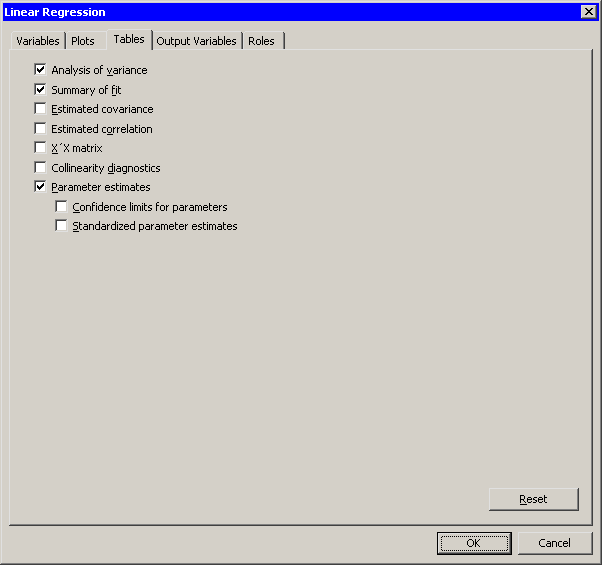
The Tables tab is shown in Figure 21.8. You can use the Tables tab to display the following tables that summarize the results of the analysis:
- Analysis of variance
- displays an ANOVA table.
- Summary of fit
- displays a table of model fit statistics.
- Estimated covariance
- displays the covariance of the parameter estimates.
- Estimated correlation
- displays the correlation of the parameter estimates.
- X'X matrix
- displays the X'X crossproducts matrix for the model. The crossproducts matrix is bordered by the X'Y and Y'Y matrices.
- Collinearity diagnostics
- displays a detailed analysis of collinearity among the regressors.
- Parameter estimates
- displays estimates for the model parameters.
|
Figure 21.16: The Tables Tab
Copyright © 2008 by SAS Institute Inc., Cary, NC, USA. All rights reserved.