| Model Fitting: Logistic Regression |
The Tables Tab
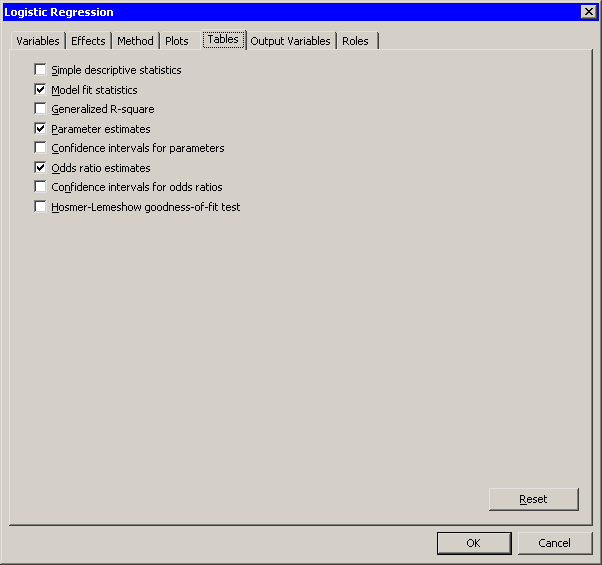
The Tables tab is shown in Figure 23.12. You can use the Tables tab to display the following tables that summarize the results of the analysis:
- Simple descriptive statistics
- displays a table of summary statistics for the explanatory variables.
- Model fit statistics
- displays a table of model fit statistics.
- Generalized R-square
- displays generalized R-square statistics.
- Parameter estimates
- displays estimates for the model parameters.
- Confidence intervals for parameters
- displays estimates of 95% confidence intervals for the model parameters.
- Odds ratios estimates
- displays the odds ratio estimates.
- Confidence intervals for odds ratios
- displays estimates of 95% confidence intervals for the odds ratios.
- Hosmer-Lemeshow goodness-of-fit test
- displays partition information and statistics for the Hosmer-Lemeshow goodness-of-fit test.
|
Figure 23.12: The Tables Tab
Copyright © 2008 by SAS Institute Inc., Cary, NC, USA. All rights reserved.