| Distribution Analysis: Descriptive Statistics |
The Plots Tab
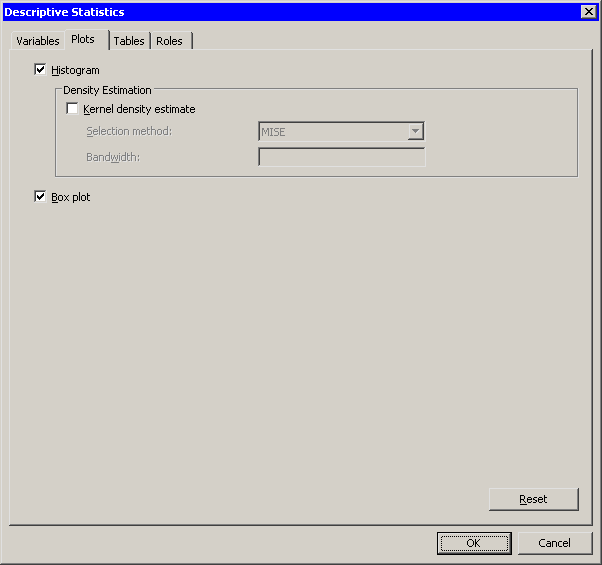
You can use the Plots tab (Figure 13.5) to create a histogram and a box plot of the chosen variable.
The histogram can include a kernel density estimate. You can determine the bandwidth for the kernel density method by selecting an option from the Selection method list. The options are as follows:
- MISE
- specifies that the kernel bandwidth is chosen to minimize an approximate mean integrated square error.
- Sheather-Jones
- specifies that the kernel bandwidth is chosen by a plug-in formula of Sheather and Jones.
- Manual
- sets the kernel bandwidth to the value of the Bandwidth field.
|
Figure 13.5: Selecting Plots
Note:
Stat Studio adds a kernel density estimate to an existing histogram
when both of the following conditions are satisfied:
- The histogram is the active window when you select the analysis.
- The histogram variable and the analysis variable are the same.
Copyright © 2008 by SAS Institute Inc., Cary, NC, USA. All rights reserved.