| Adding Variables to the DataObject |
Adding Variables to the DataObject
In previous chapters, you learned how to open a data set and how to call a SAS procedure by using the SUBMIT and ENDSUBMIT statements. This chapter shows you how to read observation-wise statistics from the output data set of a procedure, and how to add these variables to the DataObject so that you can visualize the results.
The program statements in this chapter are distributed with Stat Studio. To open the program containing the statements:
- Select File
 Open File from the main menu.
- Click Go to Installation directory near the bottom of the dialog box.
- Navigate to the Programs\Doc\STATGuide folder.
- Select the AddVar.sx file.
- Click Open.
Type or copy the following statements into a program window.
 declare DataObject dobj;
 dobj = DataObject.CreateFromFile("Hurricanes");

 dobj.WriteVarsToServerDataSet( {"wind_kts" "min_pressure"},
    "work", "Hurr", true );
These statements open the Hurricanes data set from your PC and write the wind_kts and min_pressure variables to a server data set called work.Hurr. These statements are explained in Chapter 2, "Reading and Writing Data."
In the Chapter 4, "Calling SAS Procedures," you called the REG procedure on the work.Hurr data and viewed tables and statistics in the output window. This time, you use the OUTPUT statement to create an output data set that includes the residual values for the regression model.
Add the following statements at the bottom of the program window, and select
Program ![]() Run from the main menu.
Run from the main menu.
 submit;
 proc reg data=Hurr;
    model wind_kts = min_pressure;
    output out=RegOut R=Residual;
 run;
 endsubmit;
When you run the program, Stat Studio calls the REG procedure. The procedure creates an output data set named work.RegOut that contains all of the original variables in work.Hurr, plus a new variable named Residual. This variable is created by the R= option in the OUTPUT statement.
Now that an output variable is created, you can add it to the DataObject. You can read variables in a server data set directly into a DataObject by using the CopyServerDataToDataObject module. (Note that the number of observations in work.RegOut matches the number of observations in the dobj DataObject.) After a variable is in the DataObject, you can use that variable to create graphs that help to visualize the analysis. In this case, you can create a plot of the residuals versus the explanatory variable.
Add the following statements at the bottom of the program window, and select
Program ![]() Run from the main menu.
Run from the main menu.
 ok = CopyServerDataToDataObject( "work", "RegOut", dobj,
    {"Residual" },  /* name on server */
    {"Residual" },  /* name in DataObject */
    {"Residuals" }, /* label in DataObject */
    true /* if an existing variable has this name, replace it */
    );

 declare ScatterPlot ResPlot;
 ResPlot = ScatterPlot.Create( dobj, "min_pressure", "Residual" );
The residual plot (Figure 5.1) shows many storms with
large negative residuals. These storms had much lower wind speeds
(20 - 40 knots lower) than predicted from their values of
min_pressure.
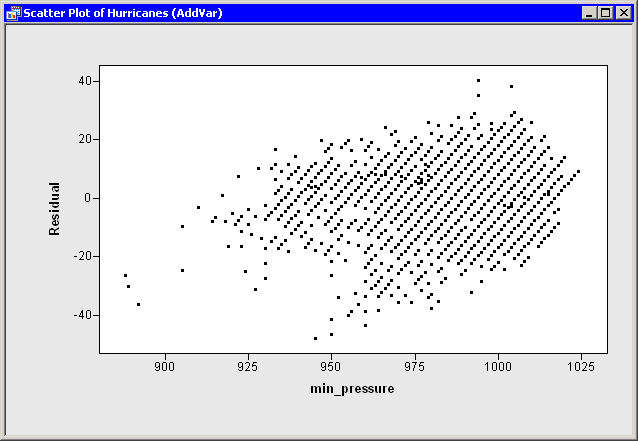
|
Figure 5.1: Creating a Residual Plot