Customizing the Kaplan-Meier Survival Plot
Displaying a Style and Extracting Font Information
You can use PROC TEMPLATE with the SOURCE statement to display a style and its parent styles in the SAS log:
proc template;
   source styles.htmlblue / expand;
run;
The results of this step are long and are not shown. You can write a copy of the style templates to a file as follows:
proc template;
   source styles.htmlblue / expand file='style.tmp';
run;
The EXPAND option writes the specified style (HTMLBlue), followed by its parent (Statistical), and followed by the parent’s parent (DEFAULT) to the file. The following step extracts and displays the first place in the file that the graph fonts are defined (which make the final decision in the style template):
data _null_;
   infile 'style.tmp' pad;
   input line $char80.;
   file print;
   if index(lowcase(line), ' graphfonts ') then y + 1;
   if y then put line $char80.;
   if y and index(line, ';') then stop;
run;
The results are displayed in Figure 23.38.
Figure 23.38: Graph Font Definition
   class GraphFonts /
      'NodeDetailFont' = ("<sans-serif>, <MTsans-serif>",7pt)
      'NodeInputLabelFont' = ("<sans-serif>, <MTsans-serif>",9pt)
      'NodeLabelFont' = ("<sans-serif>, <MTsans-serif>",9pt)
      'NodeTitleFont' = ("<sans-serif>, <MTsans-serif>",9pt)
      'GraphDataFont' = ("<sans-serif>, <MTsans-serif>",7pt)
      'GraphUnicodeFont' = ("<MTsans-serif-unicode>",9pt)
      'GraphValueFont' = ("<sans-serif>, <MTsans-serif>",9pt)
      'GraphLabel2Font' = ("<sans-serif>, <MTsans-serif>",10pt)
      'GraphLabelFont' = ("<sans-serif>, <MTsans-serif>",10pt)
      'GraphFootnoteFont' = ("<sans-serif>, <MTsans-serif>",10pt)
      'GraphTitleFont' = ("<sans-serif>, <MTsans-serif>",11pt,bold)
      'GraphTitle1Font' = ("<sans-serif>, <MTsans-serif>",14pt,bold)
      'GraphAnnoFont' = ("<sans-serif>, <MTsans-serif>",10pt);
|
If the GraphFonts style element is defined in the HTMLBlue style, then it will appear first in the file, followed by the definitions from the
Statistical style and then the DEFAULT style. In this case, the GraphFonts style element is defined in the DEFAULT style (last in the file), which is overridden by a definition in the Statistical
style (closer to the top of the file); that is the definition that is inherited by the HTMLBlue style and displayed in Figure 23.38.
The following step creates a new style, BigFont, that changes the GraphLabelFont style element from a regular 10-point font to a bold 12-point font and changes the GraphValueFont style element from a regular 9-point font to a bold 8-point font:
proc template;
   define style Styles.BigFont;
      parent = Styles.HTMLBlue;
      style graphfonts from graphfonts /
         'GraphLabelFont' = ("<sans-serif>, <MTsans-serif>",12pt,bold)
         'GraphValueFont' = ("<sans-serif>, <MTsans-serif>",8pt,bold);
   end;
run;
The following step creates the plot that is displayed in Figure 23.39:
ods html style=BigFont;
proc lifetest data=sashelp.BMT plots=survival(maxlen=13 atrisk);
   time T * Status(0);
   strata Group;
run;
ods html close;
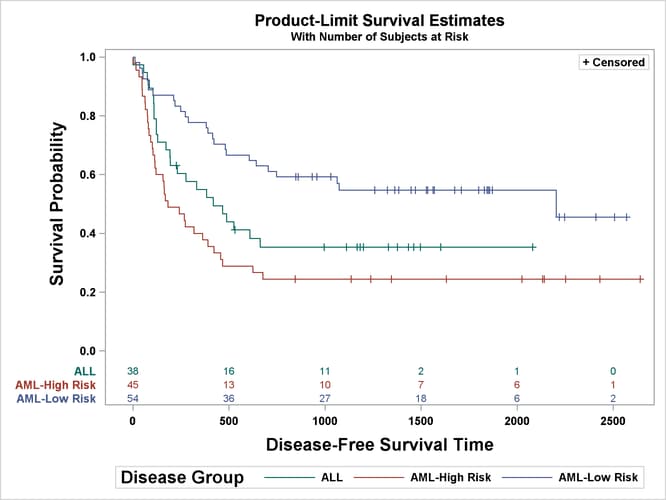
Figure 23.39: Font Modifications
You can delete the new style template as follows:
proc template;
   delete Styles.BigFont / store=sasuser.templat;
run;
For information about making ad hoc font changes in the graph templates rather than making more global font changes in style templates, see the section Changing the Font.