Customizing the Kaplan-Meier Survival Plot
Changing the Font
You can change the Y-axis, X-axis, and title fonts as follows:
%ProvideSurvivalMacros

/*-- Original Macro Variable Definitions ----------------------------------
%let TitleText0 = METHOD " Survival Estimate";
%let TitleText1 = &titletext0 " for " STRATUMID;
%let TitleText2 = &titletext0 "s";
%let yOptions   = label="Survival Probability"
                  shortlabel="Survival"
                  linearopts=(viewmin=0 viewmax=1
                              tickvaluelist=(0 .2 .4 .6 .8 1.0));
%let xOptions   = shortlabel=XNAME
                  offsetmin=.05
                  linearopts=(viewmax=MAXTIME tickvaluelist=XTICKVALS
                              tickvaluefitpolicy=XTICKVALFITPOL);
-------------------------------------------------------------------------*/

%let tatters    = textattrs=(size=12pt weight=bold family='arial');
%let TitleText0 = METHOD " Survival Estimate";
%let TitleText1 = &titletext0 " for " STRATUMID / &tatters;
%let TitleText2 = &titletext0 "s" / &tatters;

%let yOptions   = label="Survival Probability"
                  shortlabel="Survival"
                  labelattrs=(size=10pt weight=bold)
                  tickvalueattrs=(size=8pt)
                  linearopts=(viewmin=0 viewmax=1
                              tickvaluelist=(0 .2 .4 .6 .8 1.0));

%let xOptions   = shortlabel=XNAME
                  offsetmin=.05
                  labelattrs=(size=10pt weight=bold)
                  tickvalueattrs=(size=8pt)
                  linearopts=(viewmax=MAXTIME tickvaluelist=XTICKVALS
                              tickvaluefitpolicy=XTICKVALFITPOL);

%CompileSurvivalTemplates

proc lifetest data=sashelp.BMT plots=survival(cb=hw test);
   time T * Status(0);
   strata Group;
run;
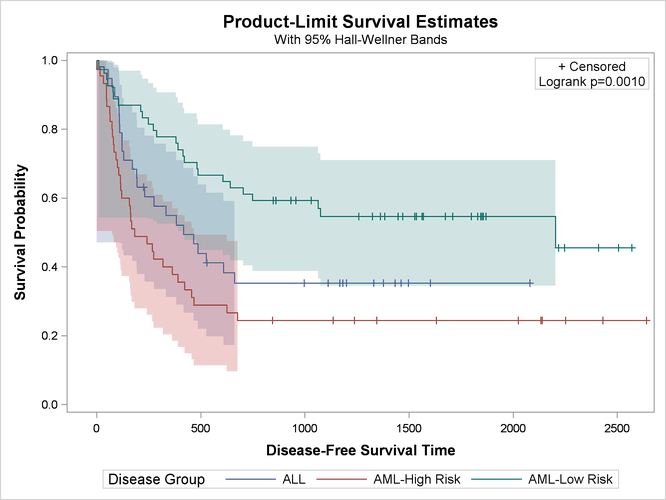
The results are displayed in Figure 23.23.
Figure 23.23: Changing the Fonts
Font options include the following:
COLOR=style-reference | color
FAMILY=style-reference | 'string'
SIZE=style-reference | dimension
STYLE=style-reference | NORMAL | ITALIC
WEIGHT=style-reference | NORMAL | BOLD
Fonts vary from installation to installation. Sample font strings include: 'Times New Roman', 'Courier New', 'Arial', and 'Calibri'. For more information about text and label attribute options, see SAS Graph Template Language: Reference. For information about changing fonts in ODS styles, see the section Displaying a Style and Extracting Font Information. ODS Graphics can use a single style element in more than one place in a graph; this example shows how to change individual graph components.