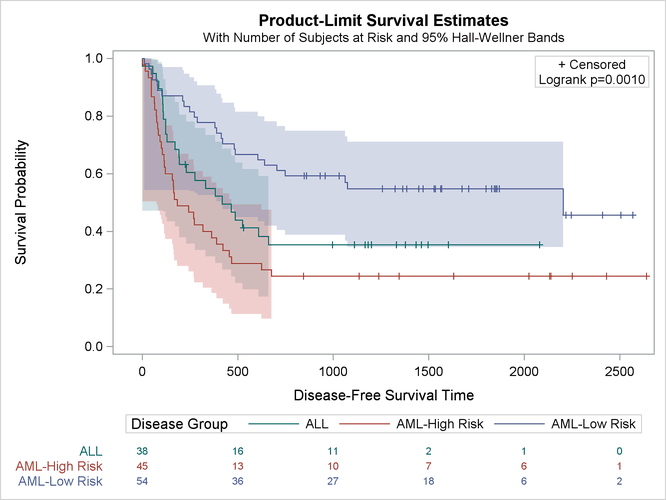
Customizing the Kaplan-Meier Survival Plot
You can use the information in Figure 23.36 to specify the desired colors in the graph template. You can copy the third, second, and first colors from each list and switch the colors as follows:
%ProvideSurvivalMacros

%let GraphOpts = DataContrastColors=(cx01665E cxA23A2E cx445694)
                 DataColors=(cx66A5A0 cxD05B5B cx6F7EB3);

%CompileSurvivalTemplates

proc lifetest data=sashelp.BMT
              plots=survival(cb=hw test atrisk(outside maxlen=13));
   time T * Status(0);
   strata Group;
run;
The results are displayed in Figure 23.37. The familiar colors are used, but they are now in a different order. The next section shows you how to modify a style template to change the color order without having to extract the original color names.
You can use the information in Figure 23.36 to modify the style template, but the next example shows an easier way.
