Customizing the Kaplan-Meier Survival Plot
You can use PROC TEMPLATE with the SOURCE statement to display a style as follows:
proc template;
   source styles.htmlblue;
run;
The results of this step, which are not shown, include the option PARENT=STYLES.STATISTICAL and do not include definitions
of the colors (gData1, gData2, ..., gData12) and contrast colors (gcData1, gcData2, ..., gcData12). These are the color definitions that are used in the style elements GraphData1, GraphData2, ..., GraphData12. You can examine the parent Statistical style as follows:
proc template;
   source styles.statistical;
run;
The results of this step are not shown because they are hard to interpret in their raw form, but the desired color definitions are included. You can submit the following statements to display the colors for the Statistical (and hence HTMLBlue) style in a more understandable form:
proc template;
   source styles.statistical / file='style.tmp';
run;

data colors;
   length element Color $ 20;
   infile 'style.tmp';
   input;
   if index(_infile_, 'data') then do;
      element = scan(_infile_, 1, ' ');
      Color = scan(_infile_, 3, ' ;');
      Type = ifc(index(element, 'gc'), 'Line', 'Fill') || ' Colors';
      i = input(compress(element, 'gcdat'';'), ?? 2.);
      if i then output;
   end;
run;

proc sort; by descending type i; run;

proc print; id type; by descending type; var color; run;
The results are displayed in Figure 23.35. All colors are specified in values of the form CXrrggbb, where the last six characters specify RGB (red, green, blue) values on the hexadecimal scale of 00 to FF (0 to 255, base 10).
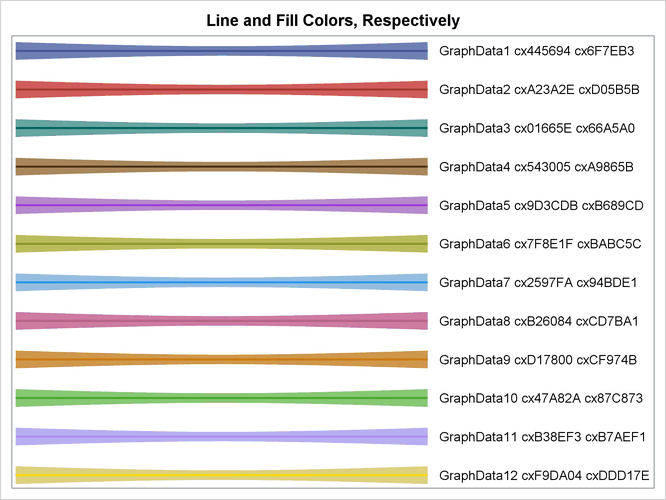
You can use the following steps to display the GraphData1 – GraphData12 line and fill colors (contrast colors and colors, respectively):
data display;
   array y[12] y1 - y12;
   do i = 1 to 12; y[i] = i;      end;
   do x = 1 to 10; output;        end;
   do i = 1 to 12; y[i] = i + .5; end;
   do x = 1 to 10; output;        end;
run;

data _null_;
   set colors;
   call symputx(compress(type || put(i, 2.)), color);
run;

proc sgplot noautolegend data=display;
   %macro reg;
      title 'Line and Fill Colors, Respectively';
      %do i = 1 %to 12;
         reg y=y%eval(13-&i) x=x / lineattrs=GraphData&i clmattrs=GraphData&i
                      nomarkers clm  curvelabelpos=max
                      curvelabel="  GraphData&i &&LineColors&i &&FillColors&i";
      %end;
   %mend;
   %reg
   xaxis display=none;
   yaxis display=none;
run;

title;
The results are displayed in Figure 23.36. The colors in Figure 23.36 are richer than the colors in the bands in the survival plots because of the DATATRANSPARENCY= options in the BANDPLOT statements.