Customizing the Kaplan-Meier Survival Plot
The plot in Figure 23.30 has a legend. However, the plot displays values in the tables by using colors that match the colors of the step functions, so you do not need the legend. The next statements show how to remove the legend:
%ProvideSurvivalMacros

%let GraphOpts  = DesignHeight=500px;
%let LegendOpts = ;

%SurvivalSummaryTable

%CompileSurvivalTemplates

proc lifetest data=sashelp.BMT
              plots=survival(cb=hw atrisk(maxlen=13));
   time T * Status(0);
   strata Group;
run;
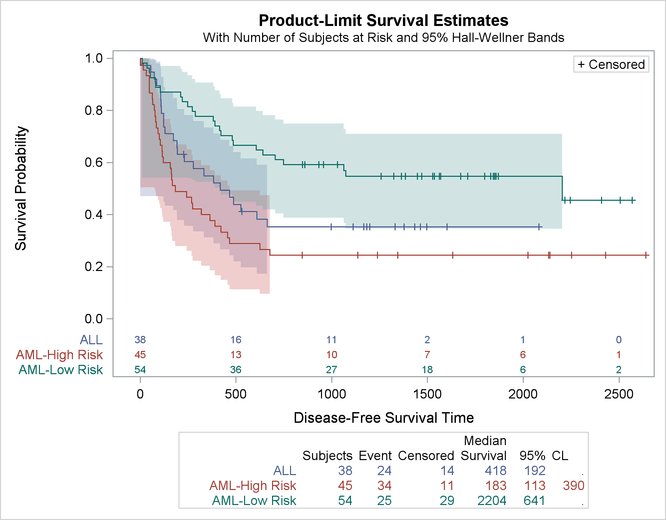
The legend is suppressed when the LegendOpts macro variable is null. This example also illustrates changing the design height to 500 pixels and moving the at-risk table
back inside the body of the plot.