Customizing the Kaplan-Meier Survival Plot
This example adds a table to the plot that displays a summary of event information. The following statements create Figure 23.30:
%ProvideSurvivalMacros

%let GraphOpts = DesignHeight=DefaultDesignWidth;

%SurvivalSummaryTable

%CompileSurvivalTemplates

proc lifetest data=sashelp.BMT
              plots=survival(cb=hw atrisk(outside maxlen=13));
   time T * Status(0);
   strata Group;
run;
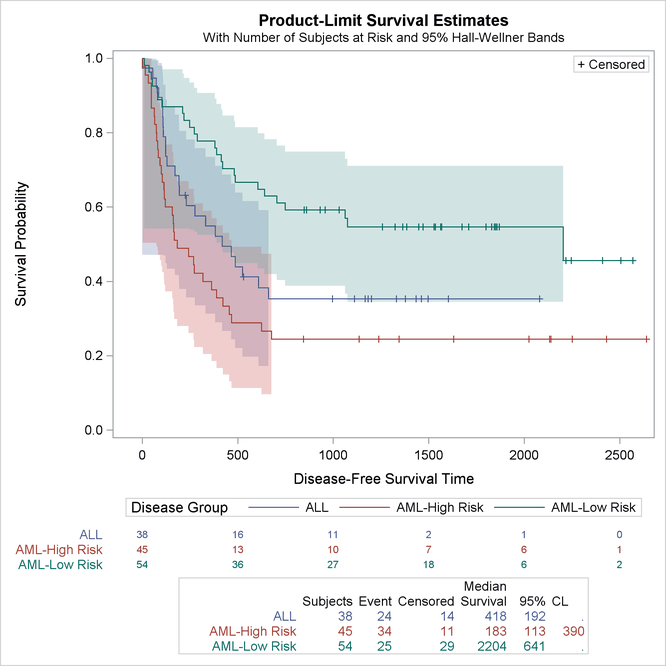
The GraphOpts macro variable specifies the option DESIGNHEIGHT=DEFAULTDESIGNWIDTH. At the default graph size (the size at which the graph
is designed), this option sets the graph height to the default graph width of 640 pixels. The macro %SurvivalSummaryTable
adds new statements to the graph templates that display the number of subjects, number of events, number of censored observations,
median survival time, and 95% confidence limits for the median survival time. For more information about the %SurvivalSummaryTable
macro, see the section Event Table Macros.