The STDRATE Procedure
- Overview
- Getting Started
-
Syntax

-
DetailsRateRiskDirect StandardizationMantel-Haenszel Effect EstimationIndirect Standardization and Standardized Morbidity/Mortality RatioAttributable Fraction and Population Attributable FractionApplicable Data Sets and Required Variables for Method SpecificationsApplicable Confidence Limits for Rate and Risk StatisticsTable OutputODS Table NamesGraphics OutputODS Graphics
-
Examples
- References
This example illustrates the use of ODS OUTPUT statement to save standardized mortality ratios for different causes and to display these statistics together in a table and in a plot.
The Florida_Cs data set contains the stratum-specific mortality information for stomach cancer and skin cancer in year 2000 for the state
of Florida (Florida Department of Health, 2000, 2013). The variable Age is the grouping variable that forms the strata in the standardization. The variables Event_C16, Event_C43, and PYear identify the number of events for stomach cancer, the number of events for skin cancer, and the person-years, respectively.
The COMMA9. format is specified in the DATA step to input numerical values that contain commas in PYear.
data Florida_Cs;
   input Age $1-5 Event_C16 Event_C43 PYear:comma9.;
   datalines;
00-04    0    0    953,785
05-14    0    0  1,997,935
15-24    0    4  1,885,014
25-34    1   14  1,957,573
35-44   19   43  2,356,649
45-54   64   72  2,088,000
55-64  114   70  1,548,371
65-74  201  126  1,447,432
75-84  294  136  1,087,524
85+    136   73    335,944
;
The following statements construct and list the mortality information by cancer cause:
data Florida_Cs;
   set Florida_Cs;
   Cause='Stomach';  Event=Event_C16;  output;
   Cause='Skin';     Event=Event_C43;  output;
   drop Event_C16 Event_C43;
run;
proc sort data=Florida_Cs;
   by Cause;
run;

proc print data=Florida_Cs;
   var Cause Age Event PYear;
run;
Output 92.4.1: Florida Data
| Obs | Cause | Age | Event | PYear |
|---|---|---|---|---|
| 1 | Skin | 00-04 | 0 | 953785 |
| 2 | Skin | 05-14 | 0 | 1997935 |
| 3 | Skin | 15-24 | 4 | 1885014 |
| 4 | Skin | 25-34 | 14 | 1957573 |
| 5 | Skin | 35-44 | 43 | 2356649 |
| 6 | Skin | 45-54 | 72 | 2088000 |
| 7 | Skin | 55-64 | 70 | 1548371 |
| 8 | Skin | 65-74 | 126 | 1447432 |
| 9 | Skin | 75-84 | 136 | 1087524 |
| 10 | Skin | 85+ | 73 | 335944 |
| 11 | Stomach | 00-04 | 0 | 953785 |
| 12 | Stomach | 05-14 | 0 | 1997935 |
| 13 | Stomach | 15-24 | 0 | 1885014 |
| 14 | Stomach | 25-34 | 1 | 1957573 |
| 15 | Stomach | 35-44 | 19 | 2356649 |
| 16 | Stomach | 45-54 | 64 | 2088000 |
| 17 | Stomach | 55-64 | 114 | 1548371 |
| 18 | Stomach | 65-74 | 201 | 1447432 |
| 19 | Stomach | 75-84 | 294 | 1087524 |
| 20 | Stomach | 85+ | 136 | 335944 |
The US_Cs data set contains the corresponding stratum-specific mortality information for the United States (Miniño et al., 2002; U.S. Bureau of the Census, 2011). The variable Age is the grouping variable that forms the strata in the standardization. The variables Event_C16, Event_C43, and PYear identify the number of events for stomach cancer, the number of events for skin cancer, and the person-years, respectively.
data US_Cs;
   input Age $1-5 Event_C16 Event_C43 PYear:comma10.;
   datalines;
00-04     0     0  19,175,798
05-14     1     1  41,077,577
15-24    14    41  39,183,891
25-34   124   186  39,892,024
35-44   484   626  45,148,527
45-54  1097  1199  37,677,952
55-64  1804  1303  24,274,684
65-74  3054  1637  18,390,986
75-84  3833  1624  12,361,180
85+    2234   803   4,239,587
;
The following statements construct and list the mortality information by cancer cause:
data US_Cs;
   set US_Cs;
   Cause='Stomach';  Event=Event_C16;  output;
   Cause='Skin';     Event=Event_C43;  output;
   drop Event_C16 Event_C43;
run;
proc sort data=US_Cs;
   by Cause;
run;

proc print data=US_Cs;
   var Cause Age Event PYear;
run;
Output 92.4.2 lists the mortality information by cancer cause.
Output 92.4.2: Florida Data
| Obs | Cause | Age | Event | PYear |
|---|---|---|---|---|
| 1 | Skin | 00-04 | 0 | 19175798 |
| 2 | Skin | 05-14 | 1 | 41077577 |
| 3 | Skin | 15-24 | 41 | 39183891 |
| 4 | Skin | 25-34 | 186 | 39892024 |
| 5 | Skin | 35-44 | 626 | 45148527 |
| 6 | Skin | 45-54 | 1199 | 37677952 |
| 7 | Skin | 55-64 | 1303 | 24274684 |
| 8 | Skin | 65-74 | 1637 | 18390986 |
| 9 | Skin | 75-84 | 1624 | 12361180 |
| 10 | Skin | 85+ | 803 | 4239587 |
| 11 | Stomach | 00-04 | 0 | 19175798 |
| 12 | Stomach | 05-14 | 1 | 41077577 |
| 13 | Stomach | 15-24 | 14 | 39183891 |
| 14 | Stomach | 25-34 | 124 | 39892024 |
| 15 | Stomach | 35-44 | 484 | 45148527 |
| 16 | Stomach | 45-54 | 1097 | 37677952 |
| 17 | Stomach | 55-64 | 1804 | 24274684 |
| 18 | Stomach | 65-74 | 3054 | 18390986 |
| 19 | Stomach | 75-84 | 3833 | 12361180 |
| 20 | Stomach | 85+ | 2234 | 4239587 |
The following statements invoke the STDRATE procedure and request indirect standardization to compute the skin and stomach
SMR estimates for the state of Florida. The BY statement requests separate analyses of causes that are defined by the Cause variable.
ods graphics on;
ods select StdInfo StrataSmrPlot Smr;
proc stdrate data=Florida_Cs refdata=US_Cs
             stat=rate
             method=indirect
             plots=smr
             ;
   population event=Event total=PYear;
   reference  event=Event total=PYear;
   strata Age;
   by Cause;
ods output smr=Smr_Cs;
run;
ods graphics off;
Only the tables and plots that are specified in the ODS SELECT statement are displayed.
The STDINFO option in the ODS SELECT statement requests that the “Standardization Information” table display the standardization information for the first BY group, skin cancer, as shown in Output 92.4.3
Output 92.4.3: Standardization Information
| Standardization Information | |
|---|---|
| Data Set | WORK.FLORIDA_CS |
| Reference Data Set | WORK.US_CS |
| Method | Indirect Standardization |
| Statistic | Rate |
| Number of Strata | 10 |
| Rate Multiplier | 100000 |
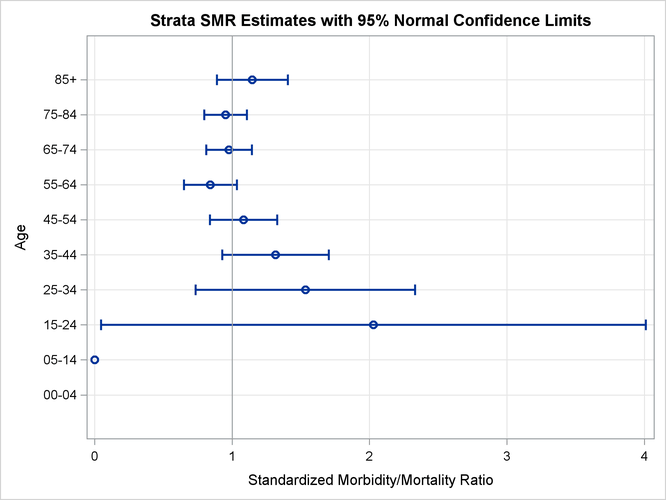
The STRATASMRPLOT option in the ODS SELECT statement requests that the strata SMR plot display stratum-specific SMR estimates for skin cancer with confidence limits, as shown in Output 92.4.4.
The SMR option in the ODS SELECT statement requests that the “Standardized Morbidity/Mortality Ratio” table display the SMR, its confidence limits, and the test for the null hypothesis ![]() for skin cancer, as shown in Output 92.4.5. With the default ALPHA=0.05,
for skin cancer, as shown in Output 92.4.5. With the default ALPHA=0.05, ![]() confidence limits are constructed.
confidence limits are constructed.
Output 92.4.5: Standardized Morbidity/Mortality Ratio
| Standardized Morbidity/Mortality Ratio | |||||||
|---|---|---|---|---|---|---|---|
| Observed Events |
Expected Events |
SMR | Standard Error |
95% Normal Confidence Limits |
Z | Pr > |Z| | |
| 538 | 528.726 | 1.0175 | 0.0439 | 0.9316 | 1.1035 | 0.40 | 0.6893 |
Similarly, the “Standardization Information” table in Output 92.4.6 displays the standardization information for the second BY group, stomach cancer.
Output 92.4.6: Standardization Information
| Standardization Information | |
|---|---|
| Data Set | WORK.FLORIDA_CS |
| Reference Data Set | WORK.US_CS |
| Method | Indirect Standardization |
| Statistic | Rate |
| Number of Strata | 10 |
| Rate Multiplier | 100000 |
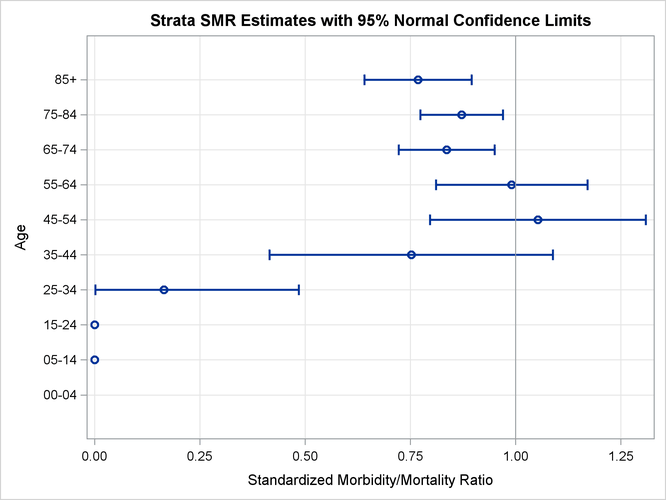
The “Strata SMR Plot” displays stratum-specific SMR estimates with confidence limits for stomach cancer, as shown in Output 92.4.7.
The “Standardized Morbidity/Mortality Ratio” table displays the SMR, its confidence limits, and the test for the null hypothesis ![]() for stomach cancer, as shown in Output 92.4.8.
for stomach cancer, as shown in Output 92.4.8.
Output 92.4.8: Standardized Morbidity/Mortality Ratio
| Standardized Morbidity/Mortality Ratio | |||||||
|---|---|---|---|---|---|---|---|
| Observed Events |
Expected Events |
SMR | Standard Error |
95% Normal Confidence Limits |
Z | Pr > |Z| | |
| 829 | 962.537 | 0.8613 | 0.0299 | 0.8026 | 0.9199 | -4.64 | <.0001 |
The ODS OUTPUT SMR=SMR_CS statement requests that the “Standardized Morbidity/Mortality Ratio” tables for the two cancer causes be saved in the data set Smr_Cs. The following statements display the selected output variables for the data set:
proc print data=Smr_Cs;
   var Cause ObservedEvents ExpectedEvents Smr SmrLcl SmrUcl;
run;
Output 92.4.9: SMR Results from BY Groups
| Obs | Cause | ObservedEvents | ExpectedEvents | Smr | SmrLcl | SmrUcl |
|---|---|---|---|---|---|---|
| 1 | Skin | 538 | 528.726 | 1.0175 | 0.9316 | 1.1035 |
| 2 | Stomach | 829 | 962.537 | 0.8613 | 0.8026 | 0.9199 |
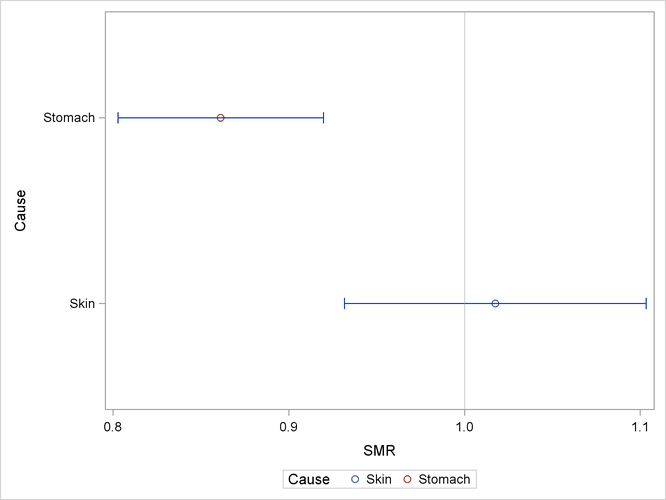
The table in Output 92.4.9 shows that the study population (state of Florida) has a higher skin cancer rate and a lower stomach cancer rate than the reference population (United States), but only the lower stomach cancer rate is significant because its corresponding SMR upper confidence limit (0.9199) is less than 1.
The following statements display the standardized morbidity/mortality ratios for the two causes in a plot:
proc sgplot data=Smr_Cs;
   scatter y=Cause x=Smr / group=Cause;
   highlow y=Cause high=SmrUcl low=SmrLcl / highcap=serif lowcap=serif;
   yaxis type=discrete;
   xaxis label="SMR";
   refline 1 / axis=x transparency=0.5;
run;
Alternatively, you can also use the following statements to obtain separate analyses for the two cancer causes, and then to display these standardized mortality ratios together in a table and in a plot:
/*----- Perform Separate Analyses for Different Causes ------*/
ods graphics on;
ods select StdInfo StrataSmrPlot Smr;
proc stdrate data=Florida_Cs refdata=US_Cs
             stat=rate
             method=indirect
             plots=smr
             ;
   population event=Event_C43 total=PYear;
   reference  event=Event_C43 total=PYear;
   strata Age;
ods output smr=Smr_c43;
run;


ods select StdInfo StrataSmrPlot Smr;
proc stdrate data=Florida_Cs refdata=US_Cs
             stat=rate
             method=indirect
             plots=smr
             ;
   population event=Event_C16 total=PYear;
   reference  event=Event_C16 total=PYear;
   strata Age;
ods output smr=Smr_c16;
run;
ods graphics off;

/*------------ Combine SMRs -----------*/
data Smr_C43;
   set Smr_C43;
   length Cause $ 7.;
   Cause='Skin';
run;

data Smr_C16;
   set Smr_C16;
   length Cause $ 7.;
   Cause='Stomach';
run;

data Smr_Cs;
   set Smr_C43 Smr_C16;
run;

/*------- Display the Cause-Specific SMRs --------*/
proc print data=Smr_Cs;
   var Cause ObservedEvents ExpectedEvents Smr SmrLcl SmrUcl;
run;

proc sgplot data=Smr_Cs;
   scatter y=Cause x=Smr / group=Cause;
   highlow y=Cause high=SmrUcl low=SmrLcl / highcap=serif lowcap=serif;
   yaxis type=discrete;
   xaxis label="SMR";
   refline 1 / axis=x transparency=0.5;
run;