SAS styles control the colors displayed in graphs. The style elements GraphData1, GraphData2, ..., GraphData12 control the appearance of groups of observations such as the survival step plots in the Kaplan-Meier plot. You can override
these colors by using the GraphOpts macro variable (which is null by default). By default, the colors for the first three groups in the HMTLBlue style are shades
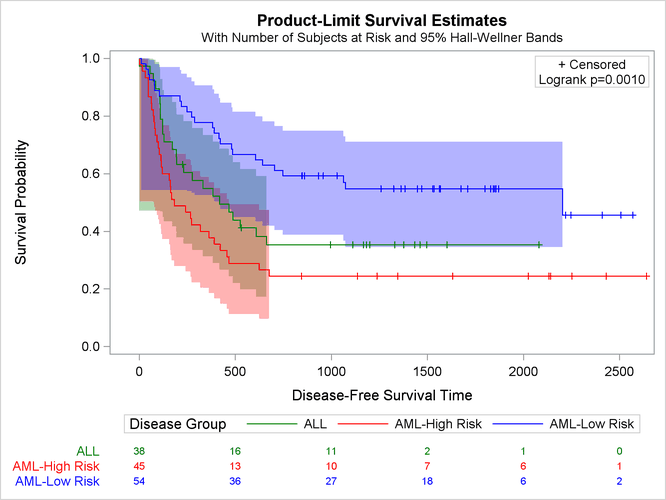
of blue, red, and green. You can change them to a pure green, red, and blue as follows:
%ProvideSurvivalMacros

%let GraphOpts = DataContrastColors=(green red blue)
                 DataColors=(green red blue);

%CompileSurvivalTemplates

proc lifetest data=sashelp.BMT
              plots=survival(cb=hw test atrisk(outside maxlen=13));
   time T * Status(0);
   strata Group;
run;
The results are displayed in Figure 23.21. The DATACONTRASTCOLORS= option specifies the contrast colors, which are used for markers and lines. The DATACOLORS= option specifies the colors, which are used for shaded areas such as confidence bands.
The original colors (as shown in Figure 23.33) are more subtle than those shown in Figure 23.21. If you want to change the order of the original colors by using this approach, then you need to know what they are so that you can specify them. The graph colors for the HTMLBlue and Statistical styles are extracted from the style in the section Displaying a Style and Extracting Color Lists and displayed in Figure 23.36. The section Modifying Color Lists shows you how to change the graph template to specify the original colors in a different order. The section Swapping Colors among Style Elements shows you how to use a macro to change a style template to specify the original colors in a different order (without having to extract and specify the color names).