The TTEST Procedure

Senn (2002, Chapter 3) discusses a study comparing the effectiveness of two bronchodilators, formoterol (“for”) and salbutamol (“sal”), in the treatment of childhood asthma. A total of 13 children are recruited for an AB/BA crossover design. A random sample of 7 of the children are assigned to the treatment sequence for/sal, receiving a dose of formoterol upon an initial visit (“period 1”) and then a dose of salbutamol upon a later visit (“period 2”). The other 6 children are assigned to the sequence sal/for, receiving the treatments in the reverse order but otherwise in a similar manner. Periods 1 and 2 are sufficiently spaced so that no carryover effects are suspected. After a child inhales a dose of a bronchodilator, peak expiratory flow (PEF) is measured. Higher PEF indicates greater effectiveness. The data are assumed to be approximately normally distributed.
The data set is generated with the following statements:
data asthma;
   input Drug1 $ Drug2 $ PEF1 PEF2 @@;
   datalines;
for sal 310 270   for sal 310 260  for sal 370 300
for sal 410 390   for sal 250 210  for sal 380 350
for sal 330 365
sal for 370 385   sal for 310 400  sal for 380 410
sal for 290 320   sal for 260 340  sal for 90  220
;
You can display the data by using the following statements, which produce Output 99.4.1:
proc print data=asthma;
run;
Output 99.4.1: Asthma Study Data
| Obs | Drug1 | Drug2 | PEF1 | PEF2 |
|---|---|---|---|---|
| 1 | for | sal | 310 | 270 |
| 2 | for | sal | 310 | 260 |
| 3 | for | sal | 370 | 300 |
| 4 | for | sal | 410 | 390 |
| 5 | for | sal | 250 | 210 |
| 6 | for | sal | 380 | 350 |
| 7 | for | sal | 330 | 365 |
| 8 | sal | for | 370 | 385 |
| 9 | sal | for | 310 | 400 |
| 10 | sal | for | 380 | 410 |
| 11 | sal | for | 290 | 320 |
| 12 | sal | for | 260 | 340 |
| 13 | sal | for | 90 | 220 |
The variables PEF1 and PEF2 represent the responses for the first and second periods, respectively. The variables Drug1 and Drug2 represent the treatment in each period.
You can analyze this crossover design by using the CROSSOVER= option after a slash (/) in the VAR statement:
ods graphics on;

proc ttest data=asthma plots=interval;
   var PEF1 PEF2 / crossover= (Drug1 Drug2);
run;

ods graphics off;
With the default PROC TTEST options TEST=DIFF and DIST=NORMAL and the lack of the IGNOREPERIOD option in the VAR statement, both the treatment difference and the period difference are assessed. The PROC TTEST default options H0=0, SIDES=2, and ALPHA=0.05 specify a two-sided analysis with 95% confidence limits comparing treatment and period differences to a default difference of zero. The default CI=EQUAL option in the PROC TTEST statement requests equal-tailed confidence intervals for standard deviations. The PLOTS=INTERVAL option produces TYPE=TREATMENT confidence intervals, in addition to the default plots AGREEMENT(TYPE=TREATMENT), BOX, HISTOGRAM, PROFILES(TYPE=TREATMENT), and QQ.
Output 99.4.2 summarizes the response and treatment variables for each period.
Output 99.4.2: Crossover Variable Information
| Crossover Variable Information |
||
|---|---|---|
| Period | Response | Treatment |
| 1 | PEF1 | Drug1 |
| 2 | PEF2 | Drug2 |
Output 99.4.3 displays basic summary statistics (sample size, mean, standard deviation, standard error, minimum, and maximum) for each of the four cells in the design, the treatment difference within each treatment sequence, the overall treatment difference, and the overall period difference.
Output 99.4.3: Statistics
| Sequence | Treatment | Period | N | Mean | Std Dev | Std Err | Minimum | Maximum |
|---|---|---|---|---|---|---|---|---|
| 1 | for | 1 | 7 | 337.1 | 53.7631 | 20.3206 | 250.0 | 410.0 |
| 2 | for | 2 | 6 | 345.8 | 70.8814 | 28.9372 | 220.0 | 410.0 |
| 2 | sal | 1 | 6 | 283.3 | 105.4 | 43.0245 | 90.0000 | 380.0 |
| 1 | sal | 2 | 7 | 306.4 | 64.7247 | 24.4636 | 210.0 | 390.0 |
| 1 | Diff (1-2) | 7 | 30.7143 | 32.9682 | 12.4608 | -35.0000 | 70.0000 | |
| 2 | Diff (1-2) | 6 | 62.5000 | 44.6934 | 18.2460 | 15.0000 | 130.0 | |
| Both | Diff (1-2) | 46.6071 | 19.3702 | 10.7766 | ||||
| Both | Diff (1-2) | -15.8929 | 19.3702 | 10.7766 |
The treatment difference “Diff (1-2)” corresponds to the “for” treatment minus the “sal” treatment, because “for” appears before “sal” in the output, according to the ORDER=MIXED default PROC TTEST option. Its mean estimate is 46.6071, favoring formoterol over salbutamol.
The standard deviation (Std Dev) reported for a “difference” is actually the pooled standard deviation across both treatment sequence (for/sal and sal/for), assuming equal variances. The standard error (Std Err) is the standard deviation of the mean estimate.
The top half of the table in Output 99.4.4 shows 95% two-sided confidence limits for the means for the same criteria addressed in the table in Output 99.4.3.
Output 99.4.4: Confidence Limits
| Sequence | Treatment | Period | Method | Mean | 95% CL Mean | Std Dev | 95% CL Std Dev | ||
|---|---|---|---|---|---|---|---|---|---|
| 1 | for | 1 | 337.1 | 287.4 | 386.9 | 53.7631 | 34.6446 | 118.4 | |
| 2 | for | 2 | 345.8 | 271.4 | 420.2 | 70.8814 | 44.2447 | 173.8 | |
| 2 | sal | 1 | 283.3 | 172.7 | 393.9 | 105.4 | 65.7841 | 258.5 | |
| 1 | sal | 2 | 306.4 | 246.6 | 366.3 | 64.7247 | 41.7082 | 142.5 | |
| 1 | Diff (1-2) | 30.7143 | 0.2238 | 61.2048 | 32.9682 | 21.2445 | 72.5982 | ||
| 2 | Diff (1-2) | 62.5000 | 15.5972 | 109.4 | 44.6934 | 27.8980 | 109.6 | ||
| Both | Diff (1-2) | Pooled | 46.6071 | 22.8881 | 70.3262 | 19.3702 | 13.7217 | 32.8882 | |
| Both | Diff (1-2) | Satterthwaite | 46.6071 | 21.6585 | 71.5558 | ||||
| Both | Diff (1-2) | Pooled | -15.8929 | -39.6119 | 7.8262 | 19.3702 | 13.7217 | 32.8882 | |
| Both | Diff (1-2) | Satterthwaite | -15.8929 | -40.8415 | 9.0558 | ||||
For the mean differences, both pooled (assuming equal variances for both treatment sequences) and Satterthwaite (assuming unequal variances) intervals are shown. For example, the pooled confidence limits for the overall treatment mean difference (for – sal) assuming equal variances are 22.8881 and 70.3262.
The bottom half of Output 99.4.4 shows 95% equal-tailed confidence limits for the standard deviations within each cell and for the treatment difference within each sequence. It also shows confidence limits for the pooled common standard deviation assuming equal variances. Note that the pooled standard deviation of 19.3702 and associated confidence limits 13.7217 and 32.8882 apply to both difference tests (treatment and period), since each of those tests involves the same pooled standard deviation.
Output 99.4.5 shows the results of t tests of treatment and period differences.
Output 99.4.5: t Tests
| Treatment | Period | Method | Variances | DF | t Value | Pr > |t| |
|---|---|---|---|---|---|---|
| Diff (1-2) | Pooled | Equal | 11 | 4.32 | 0.0012 | |
| Diff (1-2) | Satterthwaite | Unequal | 9.1017 | 4.22 | 0.0022 | |
| Diff (1-2) | Pooled | Equal | 11 | -1.47 | 0.1683 | |
| Diff (1-2) | Satterthwaite | Unequal | 9.1017 | -1.44 | 0.1838 |
Both pooled and Satterthwaite versions of the test of treatment difference are highly significant (p = 0.0012 and p = 0.0022), and both versions of the test of period difference are insignificant (p = 0.1683 and p = 0.1838).
The folded F test of equal variances in each treatment sequence is shown in Output 99.4.6.
Output 99.4.6: Equality of Variances Test
| Equality of Variances | ||||
|---|---|---|---|---|
| Method | Num DF | Den DF | F Value | Pr > F |
| Folded F | 5 | 6 | 1.84 | 0.4797 |
The insignificant result (p = 0.48) implies a lack of evidence for unequal variances. However, it does not demonstrate equal variances, and it is not very robust to deviations from normality.
Output 99.4.7 shows the distribution of the response variables PEF1 and PEF2 within each of the four cells (combinations of two treatments and two periods) of the AB/BA crossover design, in terms of
histograms and normal and kernel density estimates.
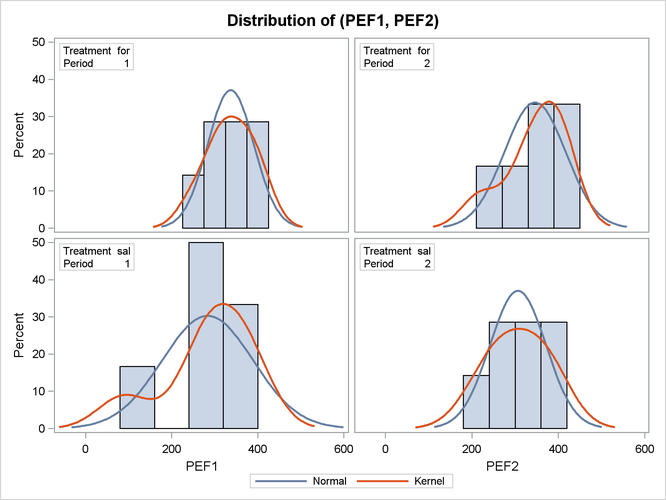
The distributions for the first treatment sequence (for/sal) appear to be somewhat symmetric, and the distributions for the sal/for sequence appear to be skewed to the left.
Output 99.4.8 shows a similar distributional summary but in terms of box plots.
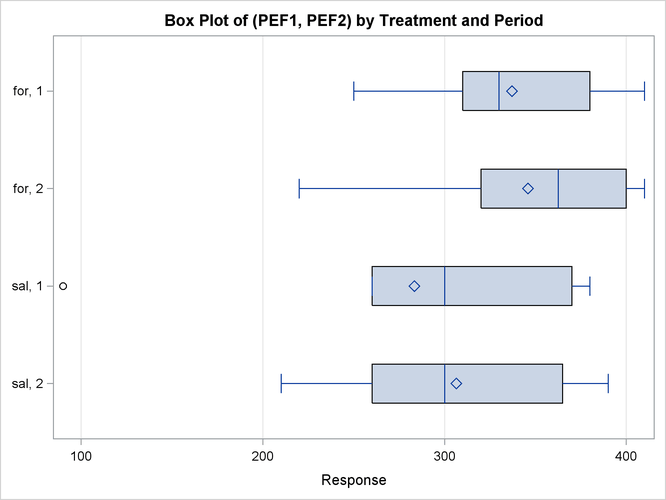
The relative locations of means and medians in each box plot corroborate the fact that the distributions for the sal/for sequence are skewed to the left. The distributions for the for/sal sequence appear to be skewed slightly to the right. The box plot for the salbutamol treatment in the first period shows an outlier (the circle on the far left side of the plot).
The treatment agreement plot in Output 99.4.9 reveals that only a single observation has a higher peak expiratory flow for salbutamol.
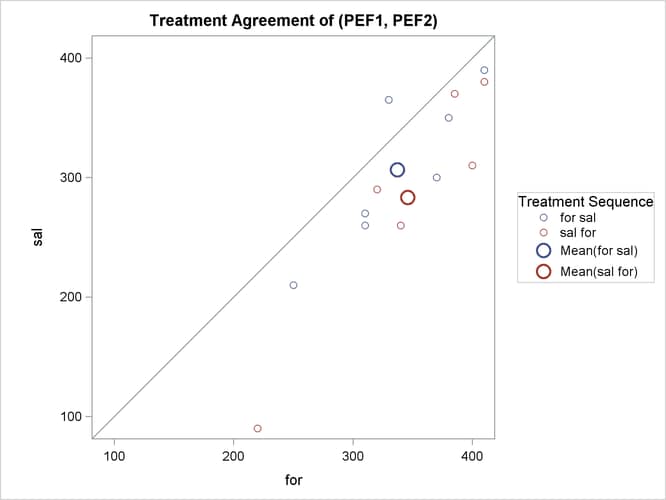
The mean for the sal/for treatment sequence is farther from the diagonal equivalence line, revealing that the treatment difference is more pronounced for the 6 observations in the sal/for sequence than for the 7 observations in the for/sal sequence. This fact is also seen numerically in Output 99.4.3 and Output 99.4.4, which show within-sequence treatment differences of 30.7 for for/sal and 62.5 for sal/for.
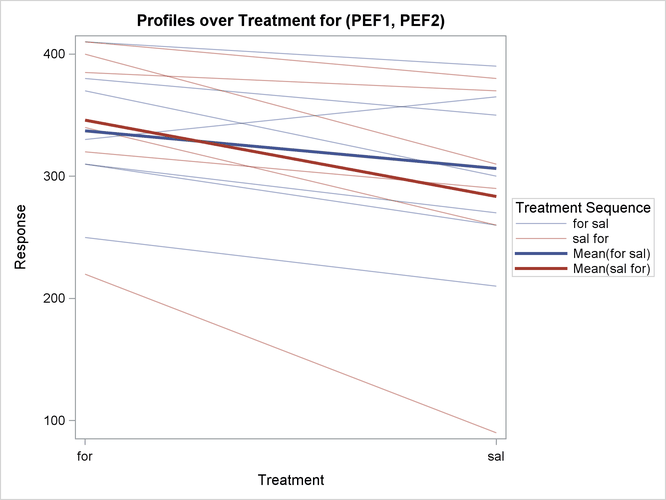
The profiles over treatment plot in Output 99.4.10 is a different view of the same information contained in Output 99.4.9, plotting the profiles from formoterol to salbutamol treatments. The lone observation for which the peak expiratory flow is higher for salbutamol appears as the only line with negative slope.
The Q-Q plots in Output 99.4.11 assess normality assumption within each of the four cells of the design.
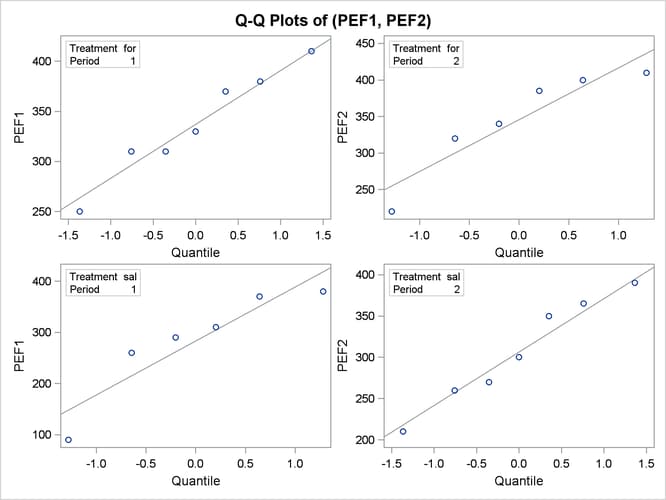
The two Q-Q plots for the sal/for sequence (lower left and upper right) suggest some possible normality violations in the tails, but the sample size is too small to make any strong conclusions. You could use the UNIVARIATE procedure with the NORMAL option to numerically check the normality assumptions.
Finally, Output 99.4.12 shows both pooled and Satterthwaite two-sided 95% confidence intervals for the treatment difference.
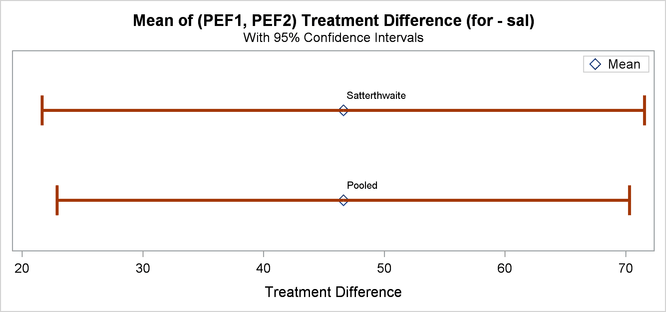
The pooled interval is slightly smaller than the Satterthwaite interval. (This is not always the case.)