Example 73.2 Basketball Data
The data in this example are rankings of 35 college basketball teams. The rankings were made before the start of the 1985–86
season by 10 news services.
The purpose of the principal component analysis is to compute a single variable that best summarizes all 10 of the preseason
rankings.
Note that the various news services rank different numbers of teams, varying from 20 through 30 (there is a missing rank in
one of the variables, WashPost). And, of course, not all services rank the same teams, so there are missing values in these data. Each of the 35 teams is
ranked by at least one news service.
The PRINCOMP procedure omits observations with missing values. To obtain principal component scores for all of the teams,
it is necessary to replace the missing values. Since it is the best teams that are ranked, it is not appropriate to replace
missing values with the mean of the nonmissing values. Instead, an ad hoc method is used that replaces missing values with
the mean of the unassigned ranks. For example, if 20 teams are ranked by a news service, then ranks 21 through 35 are unassigned.
The mean of ranks 21 through 35 is 28, so missing values for that variable are replaced by the value 28. To prevent the method
of missing-value replacement from having an undue effect on the analysis, each observation is weighted according to the number
of nonmissing values it has. See Example 74.2 in Chapter 74: The PRINQUAL Procedure, for an alternative analysis of these data.
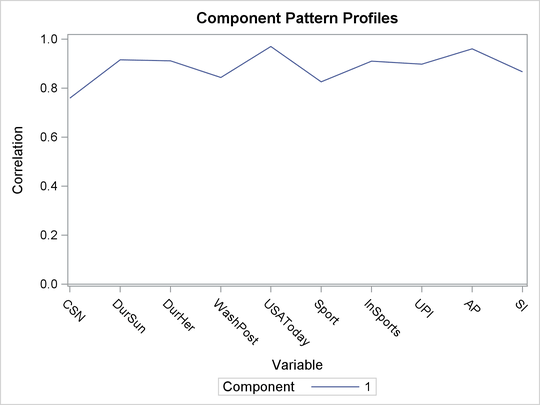
Since the first principal component accounts for 78% of the variance, there is substantial agreement among the rankings. The
eigenvector shows that all the news services are about equally weighted; this is also suggested by the nearly horizontal line
of the pattern profile plot in Output 73.2.3. So a simple average would work almost as well as the first principal component. The following statements produce Output 73.2.1.
/*-----------------------------------------------------------*/
/*                                                           */
/* Pre-season 1985 College Basketball Rankings               */
/* (rankings of 35 teams by 10 news services)                */
/*                                                           */
/* Note: (a) news services rank varying numbers of teams;    */
/*       (b) not all teams are ranked by all news services;  */
/*       (c) each team is ranked by at least one service;    */
/*       (d) rank 20 is missing for UPI.                     */
/*                                                           */
/*-----------------------------------------------------------*/

data HoopsRanks;
   input School $13. CSN DurSun DurHer WashPost USAToday
         Sport InSports UPI AP SI;
   label CSN      = 'Community Sports News (Chapel Hill, NC)'
         DurSun   = 'Durham Sun'
         DurHer   = 'Durham Morning Herald'
         WashPost = 'Washington Post'
         USAToday = 'USA Today'
         Sport    = 'Sport Magazine'
         InSports = 'Inside Sports'
         UPI      = 'United Press International'
         AP       = 'Associated Press'
         SI       = 'Sports Illustrated'
         ;
   format CSN--SI 5.1;
   datalines;
Louisville     1  8  1  9  8  9  6 10  9  9
Georgia Tech   2  2  4  3  1  1  1  2  1  1
Kansas         3  4  5  1  5 11  8  4  5  7
Michigan       4  5  9  4  2  5  3  1  3  2
Duke           5  6  7  5  4 10  4  5  6  5
UNC            6  1  2  2  3  4  2  3  2  3
Syracuse       7 10  6 11  6  6  5  6  4 10
Notre Dame     8 14 15 13 11 20 18 13 12  .
Kentucky       9 15 16 14 14 19 11 12 11 13
LSU           10  9 13  . 13 15 16  9 14  8
DePaul        11  . 21 15 20  . 19  .  . 19
Georgetown    12  7  8  6  9  2  9  8  8  4
Navy          13 20 23 10 18 13 15  . 20  .
Illinois      14  3  3  7  7  3 10  7  7  6
Iowa          15 16  .  . 23  .  . 14  . 20
Arkansas      16  .  .  . 25  .  .  .  . 16
Memphis State 17  . 11  . 16  8 20  . 15 12
Washington    18  .  .  .  .  .  . 17  .  .
UAB           19 13 10  . 12 17  . 16 16 15
UNLV          20 18 18 19 22  . 14 18 18  .
NC State      21 17 14 16 15  . 12 15 17 18
Maryland      22  .  .  . 19  .  .  . 19 14
Pittsburgh    23  .  .  .  .  .  .  .  .  .
Oklahoma      24 19 17 17 17 12 17  . 13 17
Indiana       25 12 20 18 21  .  .  .  .  .
Virginia      26  . 22  .  . 18  .  .  .  .
Old Dominion  27  .  .  .  .  .  .  .  .  .
Auburn        28 11 12  8 10  7  7 11 10 11
St. Johns     29  .  .  .  . 14  .  .  .  .
UCLA          30  .  .  .  .  .  . 19  .  .
St. Joseph's   .  . 19  .  .  .  .  .  .  .
Tennessee      .  . 24  .  . 16  .  .  .  .
Montana        .  .  . 20  .  .  .  .  .  .
Houston        .  .  .  . 24  .  .  .  .  .
Virginia Tech  .  .  .  .  .  . 13  .  .  .
;
/* PROC MEANS is used to output a data set containing the      */
/* maximum value of each of the newspaper and magazine         */
/* rankings.  The output data set, maxrank, is then used       */
/* to set the missing values to the next highest rank plus     */
/* thirty-six, divided by two (that is, the mean of the        */
/* missing ranks).  This ad hoc method of replacing missing    */
/* values is based more on intuition than on rigorous          */
/* statistical theory.  Observations are weighted by the       */
/* number of nonmissing values.                                */
/*                                                             */

title 'Pre-Season 1985 College Basketball Rankings';
proc means data=HoopsRanks;
   output out=MaxRank
          max=CSNMax DurSunMax DurHerMax
              WashPostMax USATodayMax SportMax
              InSportsMax UPIMax APMax SIMax;
run;
Output 73.2.1: Summary Statistics for Basketball Rankings Using PROC MEANS
The MEANS Procedure
| CSN |
| DurSun |
| DurHer |
| WashPost |
| USAToday |
| Sport |
| InSports |
| UPI |
| AP |
| SI |
|
| Community Sports News (Chapel Hill, NC) |
| Durham Sun |
| Durham Morning Herald |
| Washington Post |
| USA Today |
| Sport Magazine |
| Inside Sports |
| United Press International |
| Associated Press |
| Sports Illustrated |
|
| 30 |
| 20 |
| 24 |
| 19 |
| 25 |
| 20 |
| 20 |
| 19 |
| 20 |
| 20 |
|
| 15.5000000 |
| 10.5000000 |
| 12.5000000 |
| 10.4210526 |
| 13.0000000 |
| 10.5000000 |
| 10.5000000 |
| 10.0000000 |
| 10.5000000 |
| 10.5000000 |
|
| 8.8034084 |
| 5.9160798 |
| 7.0710678 |
| 6.0673607 |
| 7.3598007 |
| 5.9160798 |
| 5.9160798 |
| 5.6273143 |
| 5.9160798 |
| 5.9160798 |
|
| 1.0000000 |
| 1.0000000 |
| 1.0000000 |
| 1.0000000 |
| 1.0000000 |
| 1.0000000 |
| 1.0000000 |
| 1.0000000 |
| 1.0000000 |
| 1.0000000 |
|
| 30.0000000 |
| 20.0000000 |
| 24.0000000 |
| 20.0000000 |
| 25.0000000 |
| 20.0000000 |
| 20.0000000 |
| 19.0000000 |
| 20.0000000 |
| 20.0000000 |
|
The following statements produce Output 73.2.2 and Output 73.2.3:
data Basketball;
   set HoopsRanks;
   if _n_=1 then set MaxRank;
   array Services{10} CSN--SI;
   array MaxRanks{10} CSNMax--SIMax;
   keep School CSN--SI Weight;
   Weight=0;
   do i=1 to 10;
      if Services{i}=. then Services{i}=(MaxRanks{i}+36)/2;
      else Weight=Weight+1;
   end;
run;
ods graphics on;

proc princomp data=Basketball n=1 out=PCBasketball standard
              plots=patternprofile;
   var CSN--SI;
   weight Weight;
run;
Output 73.2.2: Principal Components Analysis of Basketball Rankings Using PROC PRINCOMP
| 13.33640553 |
13.06451613 |
12.88018433 |
13.83410138 |
12.55760369 |
13.83870968 |
13.24423963 |
13.59216590 |
12.83410138 |
13.52534562 |
| 22.08036285 |
21.66394183 |
21.38091837 |
23.47841791 |
20.48207965 |
23.37756267 |
22.20231526 |
23.25602811 |
21.40782406 |
22.93219584 |
| Community Sports News (Chapel Hill, NC) |
1.0000 |
0.6505 |
0.6415 |
0.6121 |
0.7456 |
0.4806 |
0.6558 |
0.7007 |
0.6779 |
0.6135 |
| Durham Sun |
0.6505 |
1.0000 |
0.8341 |
0.7667 |
0.8860 |
0.6940 |
0.7702 |
0.9015 |
0.8437 |
0.7518 |
| Durham Morning Herald |
0.6415 |
0.8341 |
1.0000 |
0.7035 |
0.8877 |
0.7788 |
0.7900 |
0.7676 |
0.8788 |
0.7761 |
| Washington Post |
0.6121 |
0.7667 |
0.7035 |
1.0000 |
0.7984 |
0.6598 |
0.8717 |
0.6953 |
0.7809 |
0.5952 |
| USA Today |
0.7456 |
0.8860 |
0.8877 |
0.7984 |
1.0000 |
0.7716 |
0.8475 |
0.8539 |
0.9479 |
0.8426 |
| Sport Magazine |
0.4806 |
0.6940 |
0.7788 |
0.6598 |
0.7716 |
1.0000 |
0.7176 |
0.6220 |
0.8217 |
0.7701 |
| Inside Sports |
0.6558 |
0.7702 |
0.7900 |
0.8717 |
0.8475 |
0.7176 |
1.0000 |
0.7920 |
0.8830 |
0.7332 |
| United Press International |
0.7007 |
0.9015 |
0.7676 |
0.6953 |
0.8539 |
0.6220 |
0.7920 |
1.0000 |
0.8436 |
0.7738 |
| Associated Press |
0.6779 |
0.8437 |
0.8788 |
0.7809 |
0.9479 |
0.8217 |
0.8830 |
0.8436 |
1.0000 |
0.8212 |
| Sports Illustrated |
0.6135 |
0.7518 |
0.7761 |
0.5952 |
0.8426 |
0.7701 |
0.7332 |
0.7738 |
0.8212 |
1.0000 |
| Community Sports News (Chapel Hill, NC) |
0.270205 |
| Durham Sun |
0.326048 |
| Durham Morning Herald |
0.324392 |
| Washington Post |
0.300449 |
| USA Today |
0.345200 |
| Sport Magazine |
0.293881 |
| Inside Sports |
0.324088 |
| United Press International |
0.319902 |
| Associated Press |
0.342151 |
| Sports Illustrated |
0.308570 |
Output 73.2.3: Pattern Profile Plot
The following statements produce Output 73.2.4:
proc sort data=PCBasketball;
   by Prin1;
run;
proc print;
   var School Prin1;
   title 'Pre-Season 1985 College Basketball Rankings';
   title2 'College Teams as Ordered by PROC PRINCOMP';
run;
Output 73.2.4: Basketball Rankings Using PROC PRINCOMP
| Georgia Tech |
-0.58068 |
| UNC |
-0.53317 |
| Michigan |
-0.47874 |
| Kansas |
-0.40285 |
| Duke |
-0.38464 |
| Illinois |
-0.33586 |
| Syracuse |
-0.31578 |
| Louisville |
-0.31489 |
| Georgetown |
-0.29735 |
| Auburn |
-0.09785 |
| Kentucky |
0.00843 |
| LSU |
0.00872 |
| Notre Dame |
0.09407 |
| NC State |
0.19404 |
| UAB |
0.19771 |
| Oklahoma |
0.23864 |
| Memphis State |
0.25319 |
| Navy |
0.28921 |
| UNLV |
0.35103 |
| DePaul |
0.43770 |
| Iowa |
0.50213 |
| Indiana |
0.51713 |
| Maryland |
0.55910 |
| Arkansas |
0.62977 |
| Virginia |
0.67586 |
| Washington |
0.67756 |
| Tennessee |
0.70822 |
| St. Johns |
0.71425 |
| Virginia Tech |
0.71638 |
| St. Joseph's |
0.73492 |
| UCLA |
0.73965 |
| Pittsburgh |
0.75078 |
| Houston |
0.75534 |
| Montana |
0.75790 |
| Old Dominion |
0.76821 |