The NPAR1WAY Procedure

If you specify the ANOVA option, PROC NPAR1WAY displays a “Class Means” table and an “Analysis of Variance” table for each response variable. The “Class Means” table includes the following information for each CLASS variable value (level):
-
N, which is the number of observations
-
Mean of the response variable
The “Analysis of Variance” table includes the following information for each Source of variation (Among classes and Within classes):
-
DF, which is the degrees of freedom associated with the source
-
Sum of Squares
-
Mean Square, which is the sum of squares divided by the degrees of freedom
The “Analysis of Variance” table also includes the following:
-
F Value for testing the hypothesis that the class means are equal, which is computed by dividing the Mean Square (Among) by the Mean Square (Within)
-
Pr > F, which is the significance probability corresponding to the F Value
For each score type that you specify, PROC NPAR1WAY displays a “Class Scores” table. The available score types include Wilcoxon, median, Van der Waerden (normal), Savage, Siegel-Tukey, Ansari-Bradley, Klotz, Mood, Conover, and raw data scores. PROC NPAR1WAY computes the scores for the response variable values and classifies the scored observations according to the CLASS variable values. The “Class Scores” table includes the following information for each CLASS variable level:
-
N, which is the number of observations
-
Sum of Scores
-
Expected Under H0, which is the expected sum of scores under the null hypothesis of no difference among classes
-
Std Dev Under H0, which is the standard deviation under the null hypothesis
-
Mean Score
When there are two levels of the CLASS variable, PROC NPAR1WAY displays a “Two-Sample Test” table for each analysis of scores. The “Two-Sample Test” table includes the following information:
-
Statistic, which is the sum of scores for the class with the smaller sample size
-
Z, which is the standardized test statistic and has an asymptotic standard normal distribution under the null hypothesis
-
One-Sided Pr < Z or One-Sided Pr > Z, which is the asymptotic one-sided p-value. This is displayed as Pr < Z or Pr > Z, depending on whether Z is
 0 or > 0.
-
Two-Sided Pr > |Z|, which is the asymptotic two-sided p-value
For Wilcoxon scores, the “Two-Sample Test” table also includes a t Approximation for the Wilcoxon two-sample test.
If you request an exact test by specifying the score type in the EXACT statement, the “Two-Sample Test” table also includes the following exact p-values:
-
One-Sided Pr
S or One-Sided Pr  S, which is the exact one-sided p-value. This is displayed as Pr S or Pr S, depending on whether S Mean or S > Mean, where S is the test statistic and Mean is its expected value under the null hypothesis.
-
Point Pr = S, which is the point probability. This is displayed if you specify the POINT option in the EXACT statement.
-
Two-Sided Pr
|S - Mean|, which is the exact two-sided p-value
If you request Monte Carlo estimates for a two-sample exact test by specifying the MC option in the EXACT statement, PROC NPAR1WAY displays the “Monte Carlo Estimates for the Exact Test” table, which includes the following information:
-
Estimate of One-Sided Pr
S or One-Sided Pr S, which is the exact one-sided p-value, together with its Lower and Upper Confidence Limits
-
Estimate of Two-Sided Pr
|S - Mean|, which is the exact two-sided p-value, together with its Lower and Upper Confidence Limits
-
Number of Samples used to compute the Monte Carlo estimates
-
Initial Seed used to compute the Monte Carlo estimates
For both two-sample and multisample data, PROC NPAR1WAY displays a “One-Way Analysis” table, which includes the following information:
-
Chi-Square, which is the one-way ANOVA statistic for testing the null hypothesis of no difference among classes
-
DF, which is the degrees of freedom
-
Pr > Chi-Square, which is the asymptotic p-value
For multisample data, if you request an exact test by specifying the score type in the EXACT statement, the “One-Way Analysis” table also displays the exact p-value as follows:
-
Exact Pr
Chi-Square
-
Exact Pr = Chi-Square, which is the point probability. This is displayed if you specify the POINT option in the EXACT statement.
For multisample data, if you specify the MC option in the EXACT statement, PROC NPAR1WAY displays the following information in the “Monte Carlo Estimate for the Exact Test” table:
-
Estimate of Exact Pr
Chi-Square, together with its Lower and Upper Confidence Limits
-
Number of Samples used to compute the Monte Carlo estimate
-
Initial Seed used to compute the Monte Carlo estimate
If you specify the HL option for two-sample data, PROC NPAR1WAY produces a “Hodges-Lehmann Estimation” table, which includes the following information:
-
Location Shift estimate
-
Confidence Limits for the Location Shift
-
Confidence Interval Midpoint
-
Asymptotic Standard Error estimate, which is based on the confidence interval
If you request exact Hodges-Lehmann confidence limits by specifying the HL option in the EXACT statement, the “Hodges-Lehmann Estimation” table also includes Exact Confidence Limits and the exact Interval Midpoint.
If you specify the FP option for two-sample data, PROC NPAR1WAY produces the “Fligner-Policello Placements” table and the “Fligner-Policello Test” table. The “Fligner-Policello Placements” table includes the following information for each CLASS variable level:
-
N, which is the number of observations
-
Sum, which is the sum of the placements
-
Mean, which is the average placement
-
Std Dev, which is the standard deviation of the placements
The “Fligner-Policello Test” table includes the following information:
-
Difference, which is the difference in placement sums between the two CLASS levels (samples)
-
Statistic (Z), which is the standardized test statistic and has an asymptotic standard normal distribution under the null hypothesis
-
One-Sided Pr < Z or One-Sided Pr > Z, which is the one-sided p-value. This is displayed as Pr < Z or Pr > Z, depending on whether Z is
0 or > 0.
-
Two-Sided Pr > |Z|, which is the two-sided p-value
If you specify the DSCF option for multisample data, PROC NPAR1WAY produces the “Pairwise Two-Sided Multiple Comparison Analysis” table, which includes the following information for each two-sample comparison:
-
Comparison, which identifies the two CLASS levels that are compared
-
Wilcoxon Z, which is the standardized two-sample Wilcoxon statistic
-
DSCF Value, which is the Dwass, Steel, Critchlow-Fligner statistic
-
Pr > DSCF, which is the two-sided p-value
If you specify the EDF option, PROC NPAR1WAY produces tables for the Kolmogorov-Smirnov test, the Cramér–von Mises test, and for two-sample data only, the Kuiper test.
The “Kolmogorov-Smirnov Test” table includes the following information for each CLASS variable level:
-
N, which is the number of observations
-
EDF at Maximum, which is the value of the class EDF (empirical distribution function) at its maximum deviation from the pooled EDF
-
Deviation from Mean at Maximum, which is the value of
 at its maximum, where
  is the class sample size,
  is the class EDF, and F is the pooled EDF
The “Kolmogorov-Smirnov Test” table displays the following statistics:
-
KS, which is the Kolmogorov-Smirnov statistic
-
KSa, which is the asymptotic Kolmogorov-Smirnov statistic, KSa =
 KS
KS
For two-sample data, the “Kolmogorov-Smirnov Test” table also displays the following statistics:
-
Pr > KSa, which is the asymptotic p-value for KSa and equals Pr > D
-
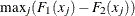
D, which is the two-sample Kolmogorov-Smirnov statistic,
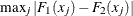
If you specify the D option for two-sample data, PROC NPAR1WAY displays the following one-sided Kolmogorov-Smirnov statistics and their asymptotic p-values in the “Kolmogorov-Smirnov Two-Sample Test” table:
-
D+, which is
-
Pr > D+
-
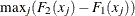
D-, which is
-
Pr > D-
For two-sample data, if you request an exact Kolmogorov-Smirnov test by specifying the KS option in the EXACT statement, PROC NPAR1WAY displays the following exact p-values in the “Kolmogorov-Smirnov Two-Sample Test” table:
-
Exact Pr
D
-
Exact Pr
D+
-
Exact Pr
D-
-
Exact Point Pr = D, Exact Point Pr = D+, and Exact Point Pr = D-, if you specify the POINT option in the EXACT statement
If you request Monte Carlo estimates for the two-sample exact Kolmogorov-Smirnov test, PROC NPAR1WAY displays the following information in the “Kolmogorov-Smirnov Two-Sample Test” table:
-
Estimate of Exact Pr
D, together with its Lower and Upper Confidence Limits
-
Estimate of Exact Pr
D+, together with its Lower and Upper Confidence Limits
-
Estimate of Exact Pr
D-, together with its Lower and Upper Confidence Limits
-
Number of Samples used to compute the Monte Carlo estimates
-
Initial Seed used to compute the Monte Carlo estimates
The “Cramér–von Mises Test” table includes the following information for each CLASS variable level:
-
N, which is the number of observations
-
Summed Deviation from Mean, which is
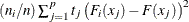
The “Cramér–von Mises Statistics” table displays the following statistics:
-
CM, which is the Cramér–von Mises statistic
-
CMa, which is the asymptotic Cramér–von Mises statistic, CMa = n CM
For two-sample data, PROC NPAR1WAY displays the “Kuiper Test” table, which includes the following information for each CLASS variable level:
-
N, which is the number of observations
-
Deviation from Mean, which is
The “Kuiper Two-Sample Statistics” table displays the following statistics:
-
K, which is the Kuiper two-sample test statistic
-
Ka, which is the asymptotic Kuiper two-sample test statistic, Ka = K

-
Pr > Ka