The LIFEREG Procedure
- Overview
-
Getting Started

-
Syntax
-
DetailsMissing ValuesModel SpecificationComputational MethodSupported DistributionsPredicted ValuesConfidence IntervalsFit StatisticsProbability PlottingINEST= Data SetOUTEST= Data SetXDATA= Data SetComputational ResourcesBayesian AnalysisDisplayed Output for Classical AnalysisDisplayed Output for Bayesian AnalysisODS Table NamesODS Graphics
-
ExamplesMotorette FailureComputing Predicted Values for a Tobit ModelOvercoming Convergence Problems by Specifying Initial ValuesAnalysis of Arbitrarily Censored Data with Interaction EffectsProbability Plotting—Right CensoringProbability Plotting—Arbitrary CensoringBayesian Analysis of Clinical Trial DataModel Postfitting Analysis
- References
The following statements create a SAS data set containing observed and right-censored lifetimes of 70 diesel engine fans (Nelson, 1982):
data Fan;
   input Lifetime Censor@@;
   Lifetime = Lifetime / 1000;
   datalines;
 450 0    460 1   1150 0   1150 0   1560 1
1600 0   1660 1   1850 1   1850 1   1850 1
1850 1   1850 1   2030 1   2030 1   2030 1
2070 0   2070 0   2080 0   2200 1   3000 1
3000 1   3000 1   3000 1   3100 0   3200 1
3450 0   3750 1   3750 1   4150 1   4150 1
4150 1   4150 1   4300 1   4300 1   4300 1
4300 1   4600 0   4850 1   4850 1   4850 1
4850 1   5000 1   5000 1   5000 1   6100 1
6100 0   6100 1   6100 1   6300 1   6450 1
6450 1   6700 1   7450 1   7800 1   7800 1
8100 1   8100 1   8200 1   8500 1   8500 1
8500 1   8750 1   8750 0   8750 1   9400 1
9900 1  10100 1  10100 1  10100 1  11500 1
;
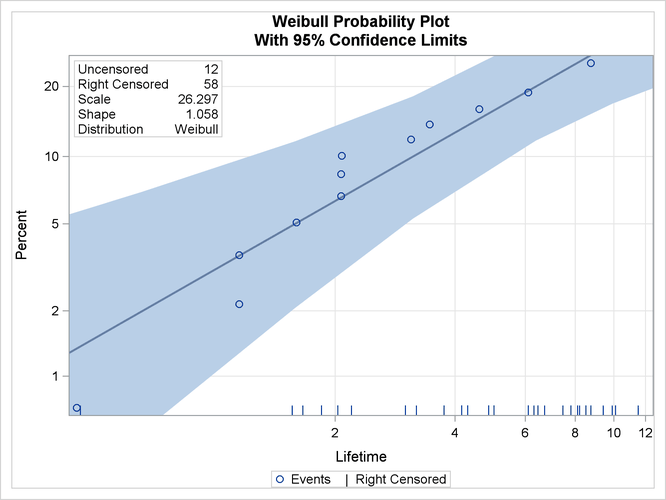
Some of the fans had not failed at the time the data were collected, and the unfailed units have right-censored lifetimes. The variable LIFETIME represents either a failure time or a censoring time, in thousands of hours. The variable CENSOR is equal to 0 if the value of LIFETIME is a failure time, and it is equal to 1 if the value is a censoring time. The following statements use the LIFEREG procedure to produce the probability plot with an inset for the engine lifetimes:
ods graphics on;
proc lifereg data=Fan;
   model Lifetime*Censor( 1 ) = / d = Weibull;
   probplot
   ppout
   npintervals=simul;
   inset;
run;
ods graphics off;
The resulting graphical output is shown in Output 51.5.1. The estimated CDF, a line representing the maximum likelihood fit, and pointwise parametric confidence bands are plotted in the body of Output 51.5.1. The values of right-censored observations are plotted along the bottom of the graph. The “Cumulative Probability Estimates” table is also created in Output 51.5.2.
Output 51.5.2: CDF Estimates
| Cumulative Probability Estimates | |||||
|---|---|---|---|---|---|
| Lifetime | Cumulative Probability |
Simultaneous 95% Confidence Limits |
Kaplan-Meier Estimate |
Kaplan-Meier Standard Error |
|
| Lower | Upper | ||||
| 0.45 | 0.0071 | 0.0007 | 0.2114 | 0.0143 | 0.0142 |
| 1.15 | 0.0215 | 0.0033 | 0.2114 | 0.0288 | 0.0201 |
| 1.15 | 0.0360 | 0.0073 | 0.2168 | 0.0433 | 0.0244 |
| 1.6 | 0.0506 | 0.0125 | 0.2304 | 0.0580 | 0.0282 |
| 2.07 | 0.0666 | 0.0190 | 0.2539 | 0.0751 | 0.0324 |
| 2.07 | 0.0837 | 0.0264 | 0.2760 | 0.0923 | 0.0361 |
| 2.08 | 0.1008 | 0.0344 | 0.2972 | 0.1094 | 0.0392 |
| 3.1 | 0.1189 | 0.0436 | 0.3223 | 0.1283 | 0.0427 |
| 3.45 | 0.1380 | 0.0535 | 0.3471 | 0.1477 | 0.0460 |
| 4.6 | 0.1602 | 0.0653 | 0.3844 | 0.1728 | 0.0510 |
| 6.1 | 0.1887 | 0.0791 | 0.4349 | 0.2046 | 0.0581 |
| 8.75 | 0.2488 | 0.0884 | 0.6391 | 0.2930 | 0.0980 |