The BOXPLOT Procedure

In a schematic box plot, outlier values within a group are plotted as separate points beyond the whiskers of the box-and-whiskers plot. See the section Styles of Box Plots and the description of the BOXSTYLE= option for a complete description of schematic box plots.
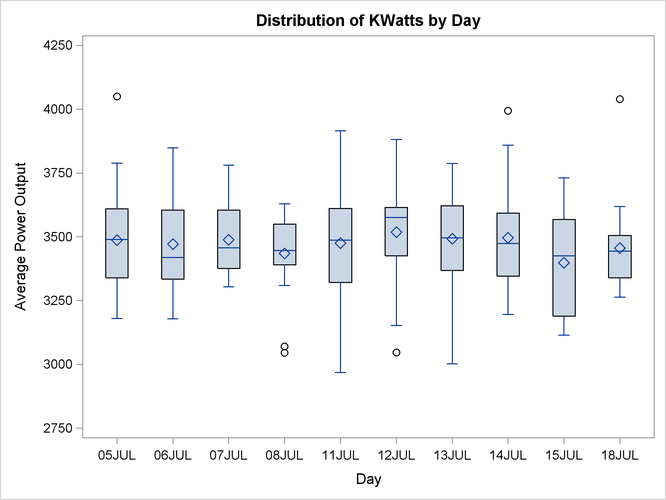
The following statements use the BOXSTYLE= option to produce a schematic box plot of the data from the Turbine data set. The OUTBOX= option creates a summary data set named OilSchematic. The ODS GRAPHICS ON statement specified before the PROC BOXPLOT statement enables ODS Graphics, so the box plot is created
using ODS Graphics instead of traditional graphics.
title 'Schematic Box Plot for Power Output';
ods graphics on;
proc boxplot data=Turbine;
   plot KWatts*Day / boxstyle = schematic
                     outbox   = OilSchematic;
run;
The schematic box plot is shown in Figure 26.4. Note the outliers plotted for several of the groups.
Whereas the Oilsum data set from the section Creating Box Plots from Summary Data contains a variable for each summary statistic and one observation per group, the OUTBOX= data set OilSchematic contains one observation for each summary statistic in each group. The _TYPE_ variable identifies the statistic and the _VALUE_ variable contains its value. In addition, the OilSchematic data set contains an observation recording each outlier value for each group. Figure 26.5 shows a partial listing of the OilSchematic data set.
Figure 26.5: The Summary Data Set OilSchematic
| Schematic Box Plot for Power Output |
| Day | _VAR_ | _TYPE_ | _VALUE_ |
|---|---|---|---|
| 05JUL | KWatts | N | 20.00 |
| 05JUL | KWatts | MIN | 3180.00 |
| 05JUL | KWatts | Q1 | 3340.00 |
| 05JUL | KWatts | MEAN | 3487.40 |
| 05JUL | KWatts | MEDIAN | 3490.00 |
| 05JUL | KWatts | Q3 | 3610.00 |
| 05JUL | KWatts | MAX | 4050.00 |
| 05JUL | KWatts | STDDEV | 220.26 |
| 05JUL | KWatts | HIWHISKR | 3789.00 |
| 05JUL | KWatts | HIGH | 4050.00 |
| 06JUL | KWatts | N | 20.00 |
| 06JUL | KWatts | MIN | 3179.00 |
| 06JUL | KWatts | Q1 | 3333.50 |
| 06JUL | KWatts | MEAN | 3471.65 |
| 06JUL | KWatts | MEDIAN | 3419.50 |
| 06JUL | KWatts | Q3 | 3605.00 |
| 06JUL | KWatts | MAX | 3849.00 |
| 06JUL | KWatts | STDDEV | 210.43 |
| 07JUL | KWatts | N | 20.00 |
| 07JUL | KWatts | MIN | 3304.00 |
| 07JUL | KWatts | Q1 | 3376.00 |
| 07JUL | KWatts | MEAN | 3488.30 |
| 07JUL | KWatts | MEDIAN | 3456.50 |
| 07JUL | KWatts | Q3 | 3604.50 |
| 07JUL | KWatts | MAX | 3781.00 |
| 07JUL | KWatts | STDDEV | 147.02 |
| 08JUL | KWatts | N | 20.00 |
| 08JUL | KWatts | MIN | 3045.00 |
| 08JUL | KWatts | Q1 | 3390.50 |
| 08JUL | KWatts | MEAN | 3434.20 |
| 08JUL | KWatts | MEDIAN | 3447.00 |
| 08JUL | KWatts | Q3 | 3550.00 |
| 08JUL | KWatts | MAX | 3629.00 |
| 08JUL | KWatts | STDDEV | 157.64 |
| 08JUL | KWatts | LOWHISKR | 3309.00 |
| 08JUL | KWatts | LOW | 3070.00 |
| 08JUL | KWatts | LOW | 3045.00 |
| 11JUL | KWatts | N | 20.00 |
| 11JUL | KWatts | MIN | 2968.00 |
| 11JUL | KWatts | Q1 | 3321.00 |
Observations with the _TYPE_ variable values “HIGH” and “LOW” contain outlier values. If you want to use a summary data set to re-create a schematic box plot, you must create an OUTBOX= data set in order to save the outlier data.