Displaying Survival Summary Statistics
PROC LIFETEST passes a number of summary statistics as dynamic variables to the survival plot template. See the section Additional Dynamic Variables for Survival Plots Using ODS Graphics in Chapter 52: The LIFETEST Procedure, for information about these dynamic variables. In this example, the graph template is modified to display survival summary statistics.
The following steps create Output 22.3.15:
%SurvivalTemplateRestore

%let fmt = bestd6.;

%macro header;
   entry halign=right "Subjects";
   entry halign=right "Event";
   entry halign=right "Censored";
   entry halign=right "Median Survival";
   entry halign=right PctMedianConfid;
   entry halign=left  "CL";
%mend;

%macro table1;
   columnheaders;
      layout overlay / pad=(top=5);
         layout gridded / columns=6 border=TRUE;
            dynamic PctMedianConfid NObs NEvent Median
                    MedianLower MedianUpper;
            %header
            entry halign=right NObs;
            entry halign=right NEvent;
            entry halign=right eval(NObs-NEvent);
            entry halign=right eval(put(Median,&fmt));
            entry halign=right eval(put(MedianLower,&fmt));
            entry halign=right eval(put(MedianUpper,&fmt));
         endlayout;
      endlayout;
   endcolumnheaders;
%mend;
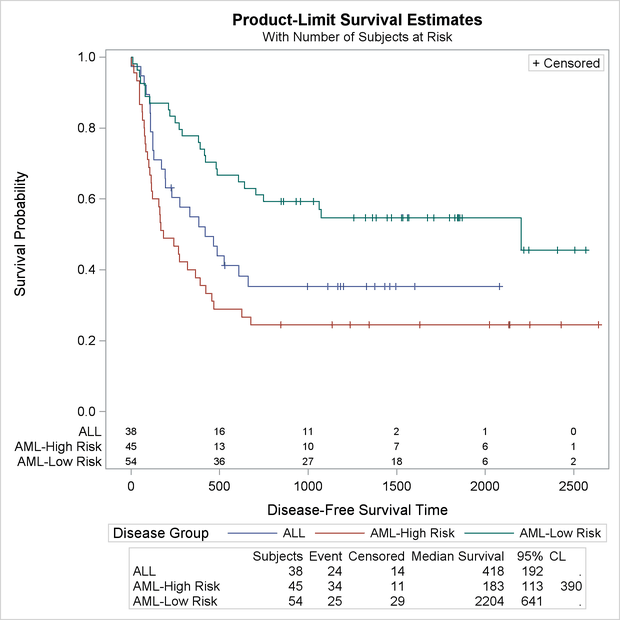
Output 22.3.15: Survival Plot with Survival Summary Statistics
%macro table2;
   columnheaders;
      layout overlay / pad=(top=5);
         layout gridded / columns=7 border=TRUE;
            dynamic PctMedianConfid;
            entry " ";
            %header
            %do i = 1 %to 6;
               dynamic StrVal&i NObs&i NEvent&i Median&i
                       LowerMedian&i UpperMedian&i;
               if (&i <= nstrata)
                  entry halign=left StrVal&i;
                  entry halign=right NObs&i;
                  entry halign=right NEvent&i;
                  entry halign=right eval(NObs&i-NEvent&i);
                  entry halign=right eval(put(Median&i,&fmt));
                  entry halign=right eval(put(LowerMedian&i,&fmt));
                  entry halign=right eval(put(UpperMedian&i,&fmt));
               endif;
            %end;
         endlayout;
      endlayout;
   endcolumnheaders;
%mend;
%macro SurvivalTemplate;
   proc template;
      define statgraph Stat.Lifetest.Graphics.ProductLimitSurvival;
         dynamic NStrata xName plotAtRisk plotCL plotHW plotEP labelCL
            %if %nrbquote(&censored) ne %then plotCensored;
            labelHW labelEP maxTime xtickVals xtickValFitPol method StratumID
            classAtRisk plotBand plotTest GroupName yMin Transparency
            SecondTitle TestName pValue;
         BeginGraph / designheight=defaultdesignwidth;

            if (NSTRATA=1)
               if (EXISTS(STRATUMID))
                  entrytitle &titletext1;
               else
                  entrytitle &titletext0;
               endif;
               if (PLOTATRISK=1)
                  entrytitle "with Number of Subjects at Risk" / textattrs=
                     GRAPHVALUETEXT;
               endif;

               layout lattice / rows=1 columns=1;
                  layout overlay / xaxisopts=(&xoptions) yaxisopts=(&yoptions);
                     %singlestratum
                  endlayout;
                  %table1
               endlayout;

            else
               entrytitle &titletext2;
               if (EXISTS(SECONDTITLE))
                  entrytitle SECONDTITLE / textattrs=GRAPHVALUETEXT;
               endif;

               layout lattice / rows=1 columns=1;
                  layout overlay / xaxisopts=(&xoptions) yaxisopts=(&yoptions);
                     %multiplestrata
                  endlayout;
                  %table2
               endlayout;
            endif;
         EndGraph;
      end;
   run;
%mend;

%SurvivalTemplate

proc lifetest data=sashelp.BMT
   plots=survival(maxlen=13 atrisk=0 to 2500 by 500);
   ods select SurvivalPlot;
   time T * Status(0);
   strata Group;
run;
This example adds new macros that provide the portions of the template that produce the survival summary statistics table. This template allows for the display of tables with up to six strata. The template could be modified to handle more strata, particularly if the height of the graphical display area is increased, but the graph starts getting busy with too many strata.
The %Header macro provides a header for the table of summary statistics. In the single-stratum case, it provides all of the column headers.
In the multiple-strata case, a blank header for the first column must be provided in addition to the column headers in the
%Header macro.
The %Table1 macro provides the summary statistics table for the single-stratum case. A LAYOUT OVERLAY statement adds padding to the top
of the table so that it is separated from the legend. A LAYOUT GRIDDED statement creates a table with six columns. The six
ENTRY statements in the %Header macro provide the column headers, and the six ENTRY statements in the %Table1 macro provide the one-line body of the table.
The %Table2 macro provides the summary statistics table for the multiple-strata case. A LAYOUT OVERLAY statement adds padding to the
top of the table so that it is separated from the legend. A LAYOUT GRIDDED statement creates a table with seven columns. The
blank ENTRY statement along with the eight ENTRY statements in the %Header macro provide the column headers, and the seven ENTRY statements in the %Table2 macro provide the multi-line body of the table. These ENTRY statements are in a macro DO loop and are repeated six times
for up to six strata. This macro also has a DYNAMIC statement that declares the dynamic variables whose values appear in the
table.
The %SurvivalTemplate macro is modified to accommodate the table. For both the single-stratum and multiple-strata cases, a LAYOUT LATTICE statement
is added so that a COLUMNHEADERS block can be added with the survival summary statistics table. The %Table1 and %Table2 macros are then added. The new statements could have been directly added to the %SurvivalTemplate macro instead of creating two additional macros. The additional macros were created solely to provide a more modular and
readable template.
You can restore the default macros, macro variables, and template by running the following steps:
%SurvivalTemplateRestore

proc template;
   delete Stat.Lifetest.Graphics.ProductLimitSurvival / store=sasuser.templat;
run;