Editing a Graph with the ODS Graphics Editor
The ODS Graphics Editor is illustrated using the following example:
data sasuser.growth;
   input country $ GDP LFG EQP NEQ GAP;
   datalines;
Argentin  0.0089 0.0118 0.0214 0.2286 0.6079
Austria   0.0332 0.0014 0.0991 0.1349 0.5809
Belgium   0.0256 0.0061 0.0684 0.1653 0.4109

   ... more lines ...

Zambia   -0.0110 0.0275 0.0702 0.2012 0.8695
Zimbabwe  0.0110 0.0309 0.0843 0.1257 0.8875
;
ods graphics on;
ods html style=Statistical sge=on;

proc robustreg data=sasuser.growth plots=(ddplot histogram);
   model GDP  = LFG GAP EQP NEQ / diagnostics leverage;
   output out=robout r=resid sr=stdres;
run;

ods _all_ close;
ods listing;
The DATA and the PROC ROBUSTREG steps are submitted to the SAS System, in this case from the SAS windowing environment, as
shown in Figure 21.16. Two versions of the graph are created: one in an uneditable PNG file (for example, DDPlot.png) and one in an editable SGE file (for example, DDPlot.sge). Both are saved in the SAS current folder. You can edit the graph in one of three ways:
-
In the Results window, double-click the second graph icon for the graph you want to edit (see Figure 21.16). The second icon corresponds to the SGE file, and the first icon corresponds to the PNG file. Clicking the first graph icon invokes a host-dependent graph viewer (for example, Microsoft Photo Editor on Windows), not the ODS Graphics Editor. Note: The Editor window might be hidden behind other windows in the SAS windowing environment.
-
You can edit the graph by selecting it in the SAS Explorer window. You must first navigate to the SAS current folder and to the SGE files.
-
You can open the graph from outside of the SAS System. For example, if you are running the SAS System under the Windows operating system, you can click on the graph’s SGE file to open it with the ODS Graphics Editor.
Figure 21.16: Results Window with Icons for Editable Plots
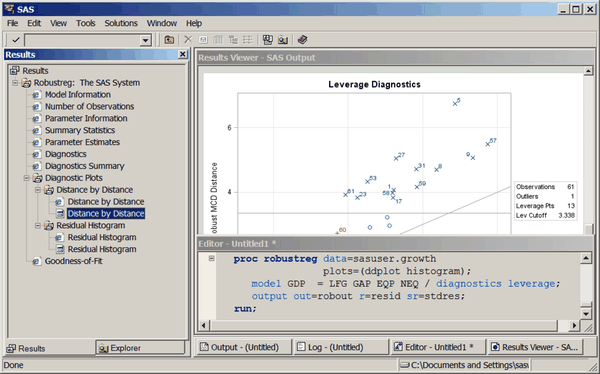
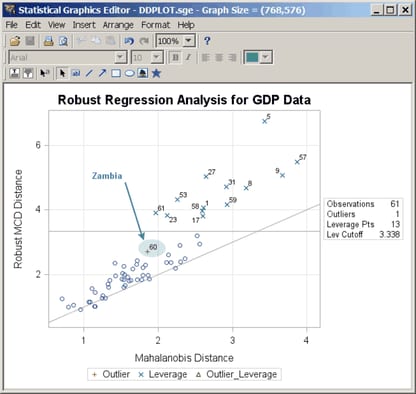
Figure 21.17 shows the ODS Graphics Editor window for the editable diagnostic plot created by PROC ROBUSTREG. In Figure 21.18, various tools in the ODS Graphics Editor are used to modify the title and annotate a particular point. The edited plot can
be saved as a PNG file or as an SGE file by selecting ![]() . After saving the plot, you can edit it again through the SAS Explorer window or by selecting
. After saving the plot, you can edit it again through the SAS Explorer window or by selecting ![]() from the ODS Graphics Editor window. Alternatively, you can reopen the saved plot for editing without first invoking the
SAS System. For example, if you are running the SAS System under the Windows operating system, you can click on the plot to
open it with the ODS Graphics Editor.
from the ODS Graphics Editor window. Alternatively, you can reopen the saved plot for editing without first invoking the
SAS System. For example, if you are running the SAS System under the Windows operating system, you can click on the plot to
open it with the ODS Graphics Editor.
The ODS Graphics Editor does not permit you to make structural changes to a graph (such as moving the positions of data points). The ODS Graphics Editor provides you with a point-and-click way to make one-time changes to a specific graph, whereas the template language (see the section Graph Templates in Chapter 22: ODS Graphics Template Modification,) provides you with a programmatic way to make template changes that persist every time you run the procedure. For complete details about the tools available in the ODS Graphics Editor, see SAS/GRAPH: ODS Graphics Editor User's Guide.
Figure 21.17: Diagnostic Plot before Editing
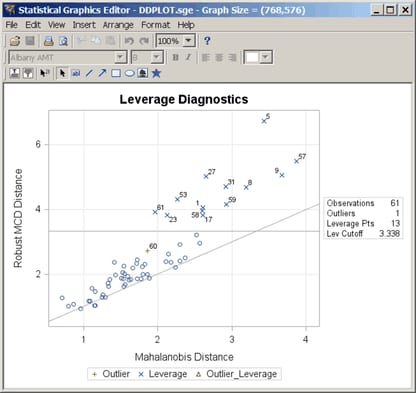
Figure 21.18: Diagnostic Plot after Editing