Modifying the Plot Title
This first part of this example changes the default title of the survival plot in PROC LIFETEST from "Product-Limit Survival Estimates" to "Kaplan-Meier Plot" through a template change.
The following statements run PROC LIFETEST to display the survival plot and to determine the template name:
proc template;
   delete Stat.Lifetest.Graphics.ProductLimitSurvival;
run;
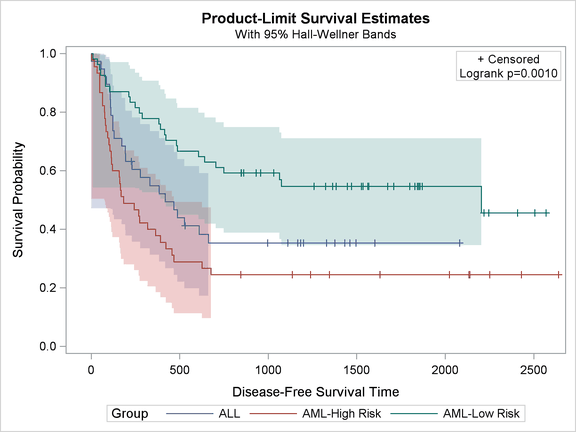
ods graphics on;
ods trace on;

proc lifetest data=sashelp.BMT plots=survival(cb=hw test);
   time T * Status(0);
   strata Group;
run;

ods trace off;
The survival plot is displayed in Output 22.3.1. Notice that the Hall-Welner bands by design stop at the last event.
The relevant part of the trace output from the SAS log is as follows:
Output Added:
-------------
Name:       SurvivalPlot
Label:      Survival Curves
Template:   Stat.Lifetest.Graphics.ProductLimitSurvival
Path:       Lifetest.SurvivalPlot
-------------
The trace output shows that the template name for the survival plot is:
Stat.Lifetest.Graphics.ProductLimitSurvival.
The following statements display the template:
proc template;
   source Stat.Lifetest.Graphics.ProductLimitSurvival;
run;
The results, at 158 lines, are lengthy. A partial display of the results is as follows:
define statgraph Stat.Lifetest.Graphics.ProductLimitSurvival;
   dynamic NStrata xName plotAtRisk plotCensored plotCL plotHW plotEP labelCL
      labelHW labelEP maxTime xtickVals xtickValFitPol method StratumID
      classAtRisk plotBand plotTest GroupName yMin Transparency SecondTitle
      TestName pValue;
   BeginGraph;
      if (NSTRATA=1)
         if (EXISTS(STRATUMID))
            entrytitle METHOD " " "Survival Estimate" " for " STRATUMID;
         else
            entrytitle METHOD " " "Survival Estimate";
         endif;
         if (PLOTATRISK)
            entrytitle "with Number of Subjects at Risk" / textattrs=
               GRAPHVALUETEXT;
         endif;
         layout overlay / xaxisopts=(shortlabel=XNAME offsetmin=.05 linearopts=
            (viewmax=MAXTIME tickvaluelist=XTICKVALS tickvaluefitpolicy=
            XTICKVALFITPOL)) yaxisopts=(label="Survival Probability" shortlabel
            ="Survival" linearopts=(viewmin=0 viewmax=1 tickvaluelist=(0 .2 .4
            .6 .8 1.0)));
            .
            .
            .
         endlayout;
      else
         entrytitle METHOD " " "Survival Estimates";
         if (EXISTS(SECONDTITLE))
            entrytitle SECONDTITLE / textattrs=GRAPHVALUETEXT;
         endif;
         layout overlay / xaxisopts=(shortlabel=XNAME offsetmin=.05 linearopts=
            (viewmax=MAXTIME tickvaluelist=XTICKVALS tickvaluefitpolicy=
            XTICKVALFITPOL)) yaxisopts=(label="Survival Probability" shortlabel
            ="Survival" linearopts=(viewmin=0 viewmax=1 tickvaluelist=(0 .2 .4
            .6 .8 1.0)));
            .
            .
            .
         endlayout;
      endif;
   EndGraph;
end;
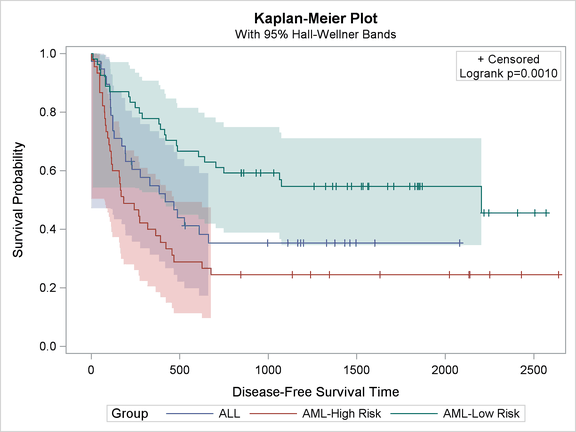
This template has a two-part structure. The graph is created one way for a single stratum (in the statements that follow if (NSTRATA=1)); otherwise it is created a different way (in the statements that follow the ELSE near the middle of the template). You can change the title by locating and changing ENTRYTITLE statements, which are the GTL statements that provide graph titles. Change just the entry titles that provide the first title lines. In most templates, all ENTRYTITLE statements are near the top of the template. They are not near the top of this template due to the two-part structure. The following step shows the changes that you could make to change the title (as displayed in Output 22.3.2):
proc template;
   define statgraph Stat.Lifetest.Graphics.ProductLimitSurvival;
      dynamic NStrata xName plotAtRisk plotCensored plotCL plotHW plotEP labelCL
         labelHW labelEP maxTime xtickVals xtickValFitPol method StratumID
         classAtRisk plotBand plotTest GroupName yMin Transparency SecondTitle
         TestName pValue;
      BeginGraph;
         if (NSTRATA=1)
            if (EXISTS(STRATUMID))
               entrytitle "Kaplan-Meier Plot for " STRATUMID;
            else
               entrytitle "Kaplan-Meier Plot";
            endif;
            if (PLOTATRISK)
               entrytitle "with Number of Subjects at Risk" / textattrs=
                  GRAPHVALUETEXT;
            endif;
            layout overlay / xaxisopts=(shortlabel=XNAME offsetmin=.05 linearopts=
               (viewmax=MAXTIME tickvaluelist=XTICKVALS tickvaluefitpolicy=
               XTICKVALFITPOL)) yaxisopts=(label="Survival Probability" shortlabel
               ="Survival" linearopts=(viewmin=0 viewmax=1 tickvaluelist=(0 .2 .4
               .6 .8 1.0)));
               .
               .
               .
            endlayout;
         else
            entrytitle "Kaplan-Meier Plot";
            if (EXISTS(SECONDTITLE))
               entrytitle SECONDTITLE / textattrs=GRAPHVALUETEXT;
            endif;
            layout overlay / xaxisopts=(shortlabel=XNAME offsetmin=.05 linearopts=
               (viewmax=MAXTIME tickvaluelist=XTICKVALS tickvaluefitpolicy=
               XTICKVALFITPOL)) yaxisopts=(label="Survival Probability" shortlabel
               ="Survival" linearopts=(viewmin=0 viewmax=1 tickvaluelist=(0 .2 .4
               .6 .8 1.0)));
               .
               .
               .
            endlayout;
         endif;
      EndGraph;
   end;
run;
Three ENTRYTITLE statements are changed. Notice that you must provide a PROC TEMPLATE statement and optionally a RUN statement in addition to making the title changes. Submit the PROC TEMPLATE step to SAS along with the following PROC LIFETEST step to create the modified graph:
proc lifetest data=sashelp.BMT plots=survival(cb=hw test);
   time T * Status(0);
   strata Group;
run;
The results are displayed in Output 22.3.2.