Adding a BY Line to Graphs
You can use the %ModTmplt macro to display in your graphs BY line information (such as Sex = ’F’ and Sex = ’M’ when the statement BY SEX is specified). The %ModTmplt macro requires you to construct a SAS macro called %MyGraph, which contains the SAS procedure that needs to be run, so that the %ModTmplt macro can call it for each BY group. The following example illustrates this usage of the macro:
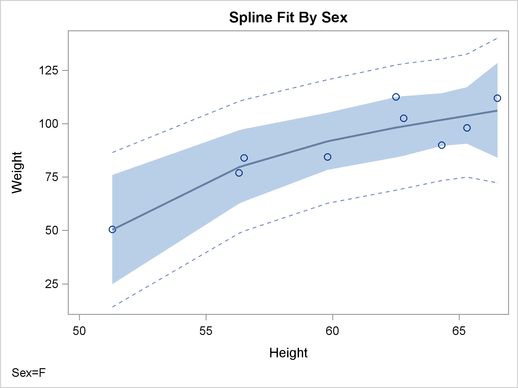
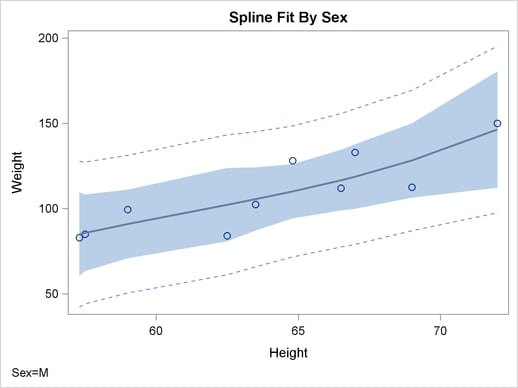
proc sort data=sashelp.class out=class;
   by sex;
run;

%macro mygraph;
proc transreg data=__bydata;
   model identity(weight) = spline(height);
%mend;

%modtmplt(by=sex, data=class, template=Stat.Transreg.Graphics)
Notice that the BY and RUN statements are not specified in the %MyGraph macro. Also notice that you must specify DATA=__BYDATA with the procedure call in the %MyGraph macro and specify the real input data set in the DATA= option of the %ModTmplt macro.
The %ModTmplt macro outputs the specified template or templates to a file, adds an ENTRYFOOTNOTE statement with the BY line information, and then runs the %MyGraph macro once for each BY group. In the end, the %ModTmplt macro deletes the modified template.
The results of the preceding statements are displayed in Figure 22.3 and Figure 22.4. The BY line is displayed as a left-justified footnote by default. You can change this with the STATEMENT= option (default: Statement=EntryFootNote Halign=Left TextAttrs=GraphValueText). For example, you can display the BY line as a centered title by specifying STATEMENT=ENTRYTITLE.