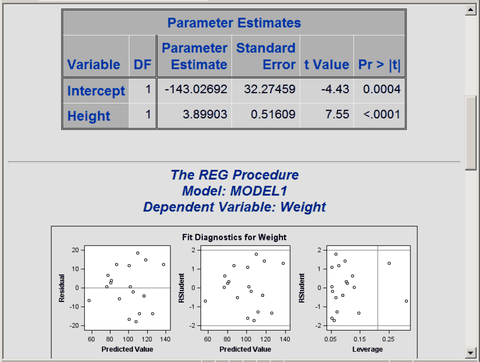
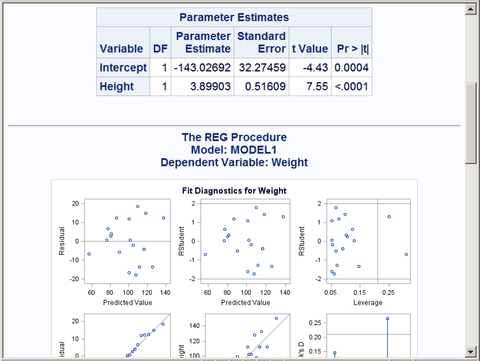
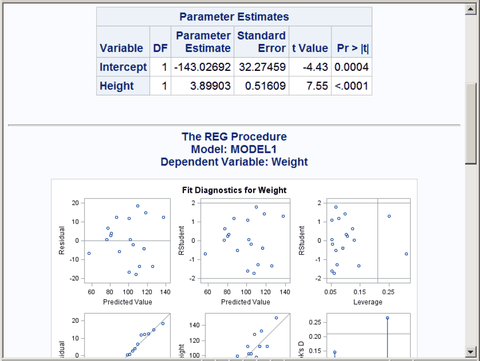
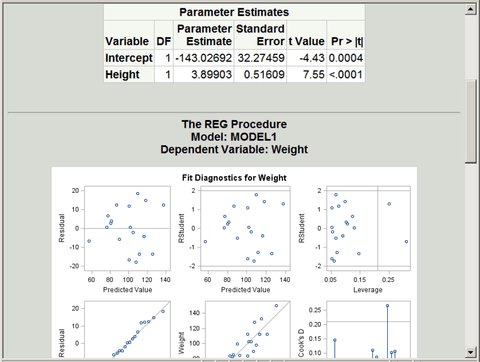
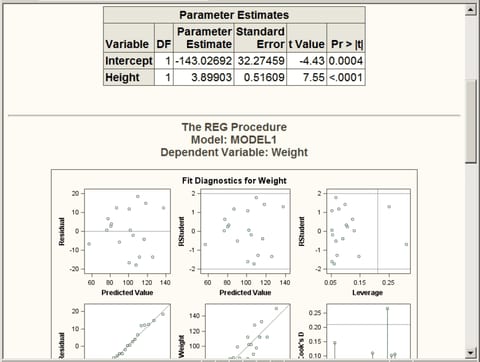
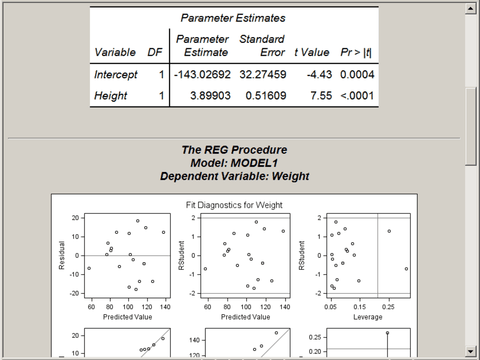
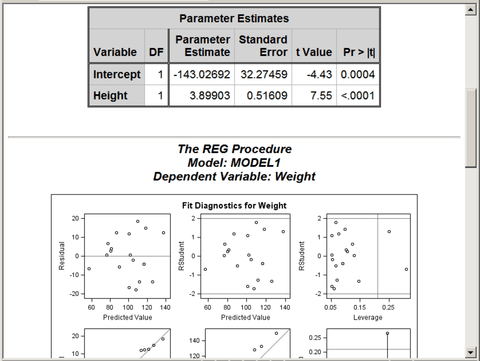
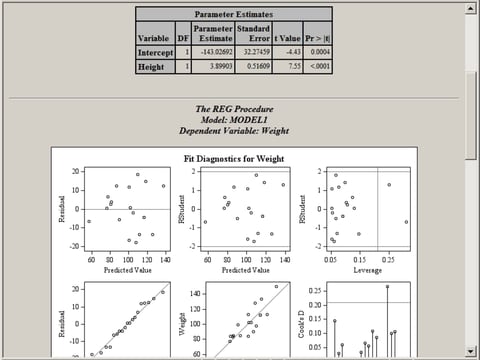
In this section, some of the most commonly used styles are compared with a series of figures, most of which were generated in the preceding section. Figure 21.19 through Figure 21.26 show tables and graphs in each of eight styles, for the following analysis:
proc reg data=sashelp.class;
   model Weight = Height;
run; quit;
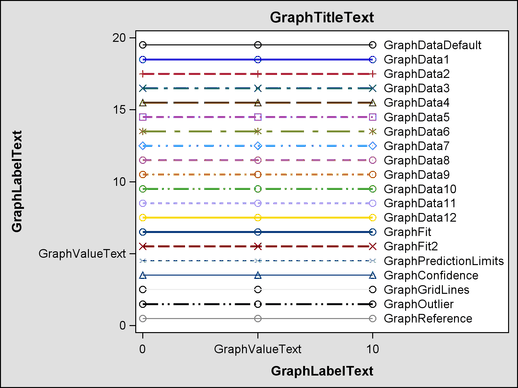
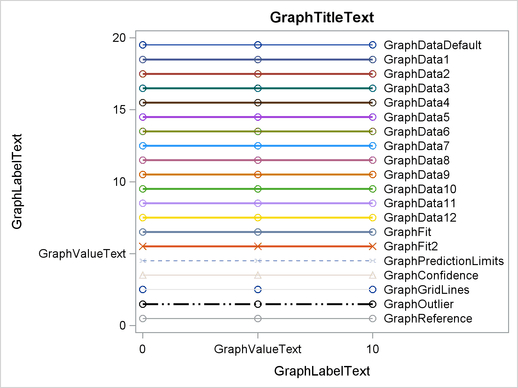
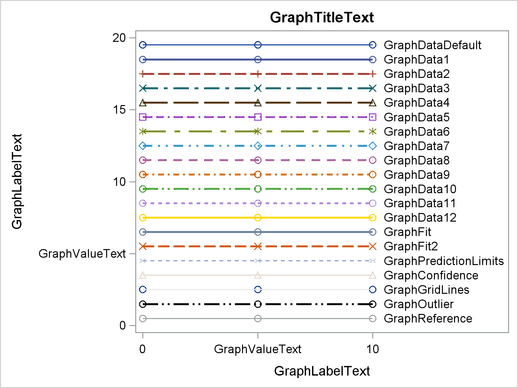
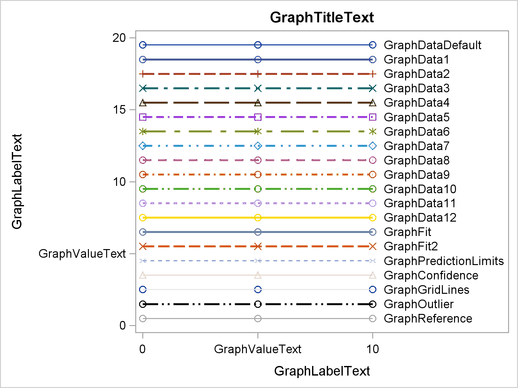
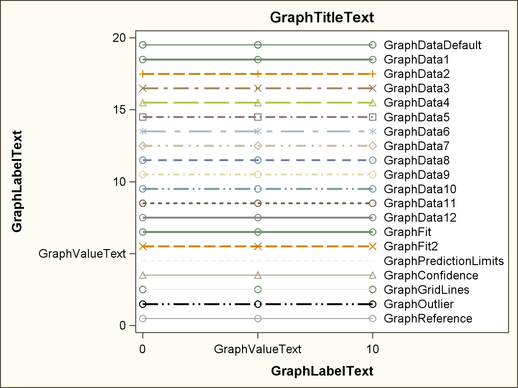
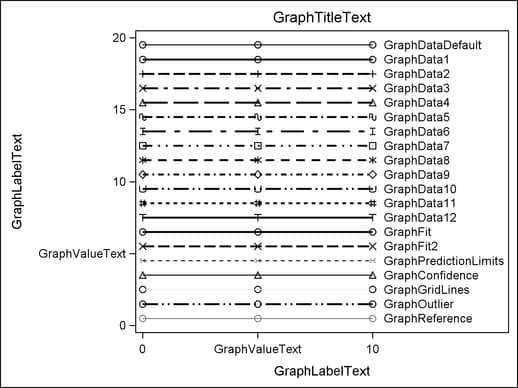
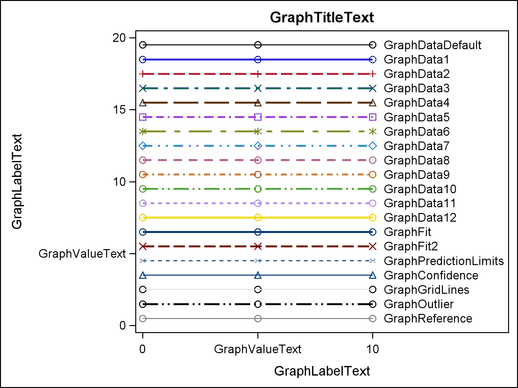
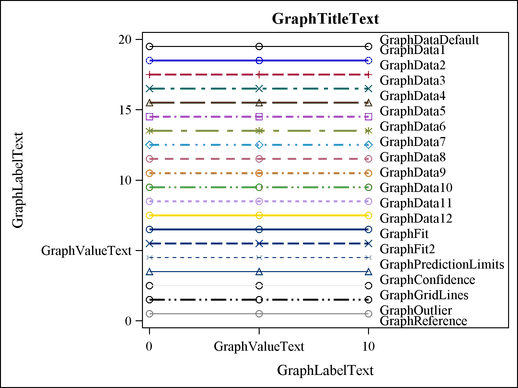
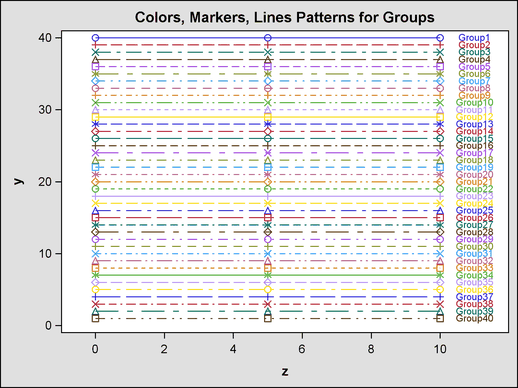
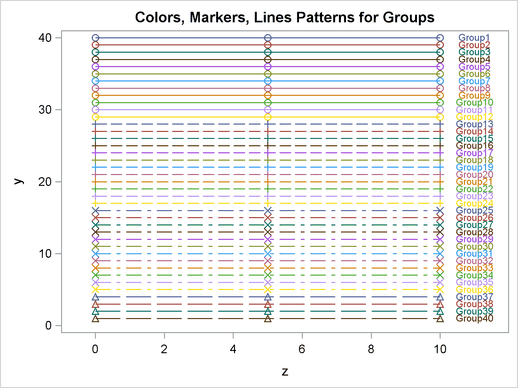
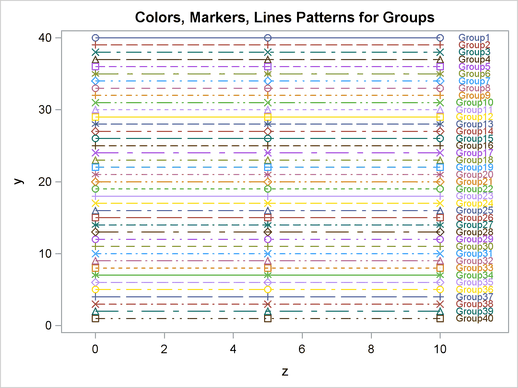
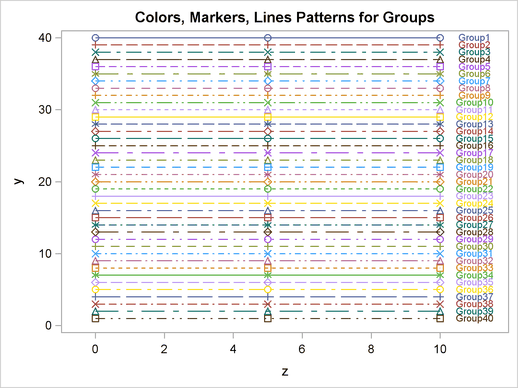
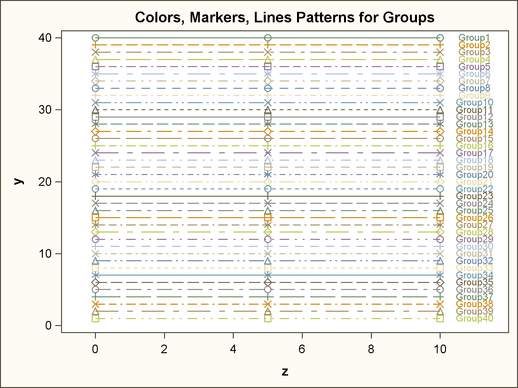
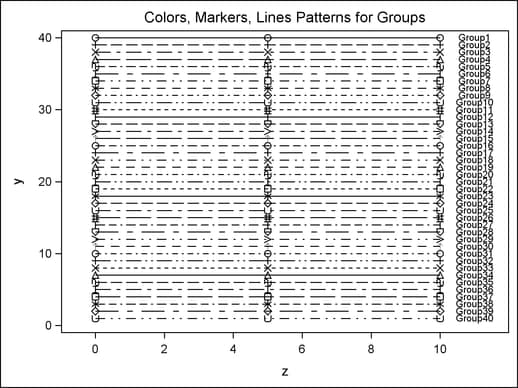
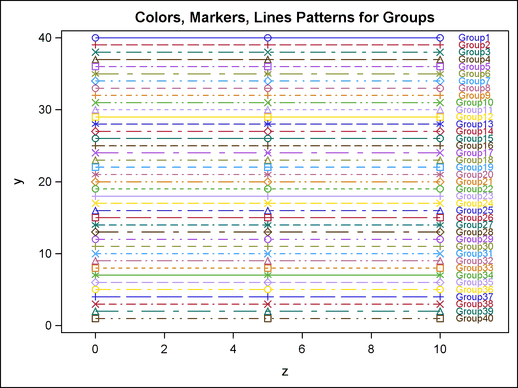
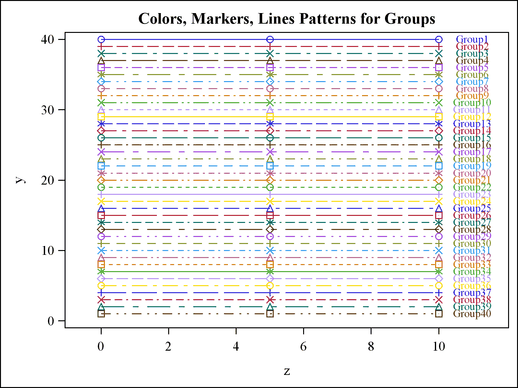
Figure 21.27 through Figure 21.34 show some of the more common style elements. Figure 21.35 through Figure 21.42 show how groups of observations are displayed in the graph.
The style comparisons are as follows:
 Figure 21.19, Figure 21.27, and Figure 21.35 show the DEFAULT style.
 Figure 21.20, Figure 21.28, and Figure 21.36 show the HTMLBLUE style.
 Figure 21.21, Figure 21.29, and Figure 21.37 show the HTMLBLUECML style.
 Figure 21.22, Figure 21.30, and Figure 21.38 show the STATISTICAL style.
 Figure 21.23, Figure 21.31, and Figure 21.39 show the ANALYSIS style.
 Figure 21.24, Figure 21.32, and Figure 21.40 show the JOURNAL style.
 Figure 21.25, Figure 21.33, and Figure 21.41 show the LISTING style.
 Figure 21.26, Figure 21.34, and Figure 21.42 show the RTF style.
Figure 21.19
Statistical Output with the DEFAULT Style
Figure 21.20
Statistical Output with the HTMLBLUE Style
Figure 21.21
Statistical Output with the HTMLBLUECML Style
Figure 21.22
Statistical Output with the STATISTICAL Style
Figure 21.23
Statistical Output with the ANALYSIS Style
Figure 21.24
Statistical Output with the JOURNAL Style
Figure 21.25
Statistical Output with the LISTING Style
Figure 21.26
Statistical Output with the RTF Style
Figure 21.27
Attributes of Style Elements in the DEFAULT Style
Figure 21.28
Attributes of Style Elements in the HTMLBLUE Style
Figure 21.29
Attributes of Style Elements in the HTMLBLUECML Style
Figure 21.30
Attributes of Style Elements in the STATISTICAL Style
Figure 21.31
Attributes of Style Elements in the ANALYSIS Style
Figure 21.32
Attributes of Style Elements in the JOURNAL Style
Figure 21.33
Attributes of Style Elements in the LISTING Style
Figure 21.34
Attributes of Style Elements in the RTF Style
Figure 21.35
Markers, Lines, and Colors with Groups in the DEFAULT Style
Figure 21.36
Markers, Lines, and Colors with Groups in the HTMLBLUE Style
Figure 21.37
Markers, Lines, and Colors with Groups in the HTMLBLUECML Style
Figure 21.38
Markers, Lines, and Colors with Groups in the STATISTICAL Style
Figure 21.39
Markers, Lines, and Colors with Groups in the ANALYSIS Style
Figure 21.40
Markers, Lines, and Colors with Groups in the JOURNAL Style
Figure 21.41
Markers, Lines, and Colors with Groups in the LISTING Style
Figure 21.42
Markers, Lines, and Colors with Groups in the RTF Style
 Figure 21.19, Figure 21.27, and Figure 21.35 show the DEFAULT style.
 Figure 21.20, Figure 21.28, and Figure 21.36 show the HTMLBLUE style.
 Figure 21.21, Figure 21.29, and Figure 21.37 show the HTMLBLUECML style.
 Figure 21.22, Figure 21.30, and Figure 21.38 show the STATISTICAL style.
 Figure 21.23, Figure 21.31, and Figure 21.39 show the ANALYSIS style.
 Figure 21.24, Figure 21.32, and Figure 21.40 show the JOURNAL style.
 Figure 21.25, Figure 21.33, and Figure 21.41 show the LISTING style.
 Figure 21.26, Figure 21.34, and Figure 21.42 show the RTF style.