| Basic Graphs (POWER, GLMPOWER, Power and Sample Size Application) |
If you include a PLOT statement, the GLMPOWER and POWER procedures produce standard power curves, which represent any multivalued input parameters with varying line styles, symbols, colors, and/or panels. The Power and Sample Size application also has an option to produce power curves. If ODS Graphics is enabled, then graphs are created using ODS Graphics; otherwise, traditional graphs are produced.
To display default power curves for the preceding PROC POWER call, add the PLOT statement with no arguments as follows:
ods listing style=htmlbluecml;
ods graphics on;

proc power plotonly;
   twosamplemeans test=diff
      meandiff = 5 6
      stddev = 12 18
      alpha = 0.05 0.1
      ntotal = 100 200
      power = .;
   plot;
run;

ods graphics off;
The ODS GRAPHICS ON statement enables ODS Graphics. The ODS LISTING STYLE=HTMLBLUECML statement specifies the HTMLBLUECML style, which is suitable for use with PROC POWER because it allows both marker symbols and line styles to vary.
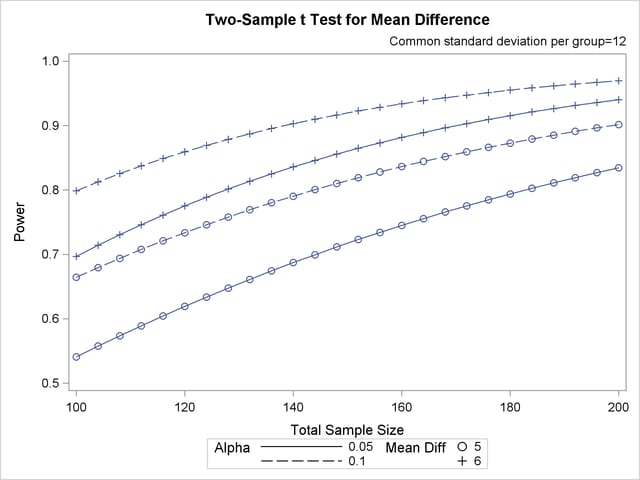
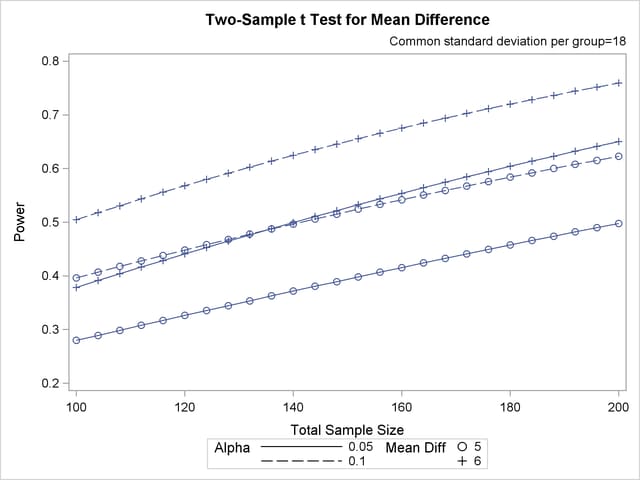
Figure 18.2 shows the results. Note that the line style varies by the significance level  , the symbol varies by the mean difference, and the panel varies by standard deviation.