Example 32.2 Bivariate Density Estimates and Posterior Probabilities
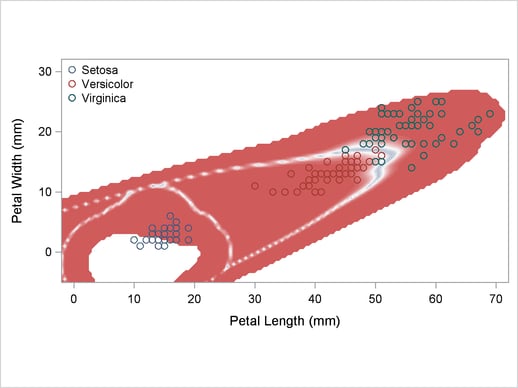
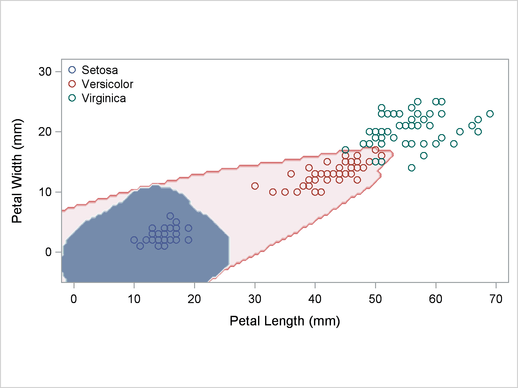
In this example, four more discriminant analyses of iris data are run with two quantitative variables: petal width and petal length. The following statements produce Output 32.2.1 through Output 32.2.5:
title 'Discriminant Analysis of Fisher (1936) Iris Data';
proc template;
   define statgraph scatter;
      begingraph;
         entrytitle 'Fisher (1936) Iris Data';
         layout overlayequated / equatetype=fit;
            scatterplot x=petallength y=petalwidth /
                        group=species name='iris';
            layout gridded / autoalign=(topleft);
               discretelegend 'iris' / border=false opaque=false;
            endlayout;
         endlayout;
      endgraph;
   end;
run;

proc sgrender data=sashelp.iris template=scatter;
run;
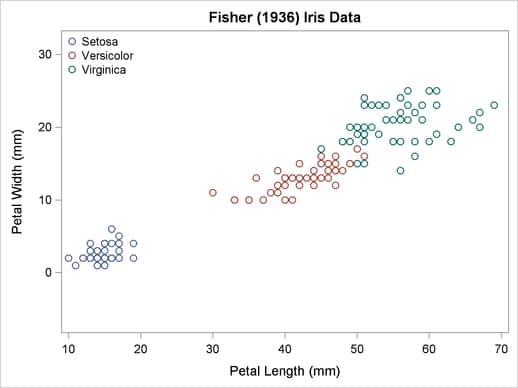
The scatter plot in Output 32.2.1 shows the joint sample distribution.
Output 32.2.1
Joint Sample Distribution of Petal Width and Petal Length in Three Species
Another data set is created for plotting, containing a grid of points suitable for contour plots. The following statements create the data set:
data plotdata;
   do PetalLength = -2 to 72 by 0.5;
      do PetalWidth= - 5 to 32 by 0.5;
         output;
      end;
   end;
run;
Three macros are defined as follows to make contour plots of density estimates, posterior probabilities, and classification results:
%let close = thresholdmin=0 thresholdmax=0 offsetmin=0 offsetmax=0;
%let close = xaxisopts=(&close) yaxisopts=(&close);

proc template;
   define statgraph contour;
      begingraph;
         layout overlayequated / equatetype=equate &close;
            contourplotparm x=petallength y=petalwidth z=z /
                            contourtype=fill nhint=30;
            scatterplot x=pl y=pw / group=species name='iris'
                        includemissinggroup=false primary=true;
            layout gridded / autoalign=(topleft);
               discretelegend 'iris' / border=false opaque=false;
            endlayout;
         endlayout;
      endgraph;
   end;
run;

%macro contden;
   data contour(keep=PetalWidth PetalLength species z pl pw);
      merge plotd(in=d) sashelp.iris(keep=PetalWidth PetalLength species
                                     rename=(PetalWidth=pw PetalLength=pl));
      if d then z = max(setosa,versicolor,virginica);
   run;

   title3 'Plot of Estimated Densities';

   proc sgrender data=contour template=contour;
   run;
%mend;

%macro contprob;
   data posterior(keep=PetalWidth PetalLength species z pl pw into);
      merge plotp(in=d) sashelp.iris(keep=PetalWidth PetalLength species
                                     rename=(PetalWidth=pw PetalLength=pl));
      if d then z = max(setosa,versicolor,virginica);
      into = 1 * (_into_ =: 'Set') + 2 * (_into_ =: 'Ver') +
             3 * (_into_ =: 'Vir');
   run;

   title3 'Plot of Posterior Probabilities ';

   proc sgrender data=posterior template=contour;
   run;
%mend;
%macro contclass;
   title3 'Plot of Classification Results';

   proc sgrender data=posterior(drop=z rename=(into=z)) template=contour;
   run;
%mend;
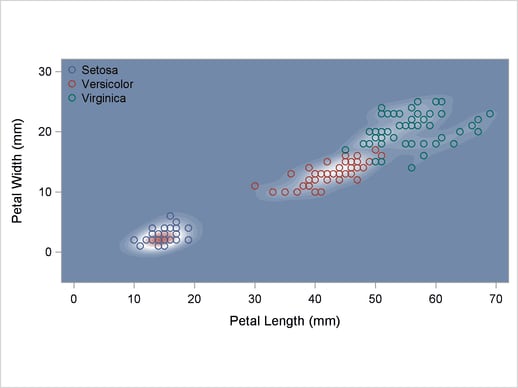
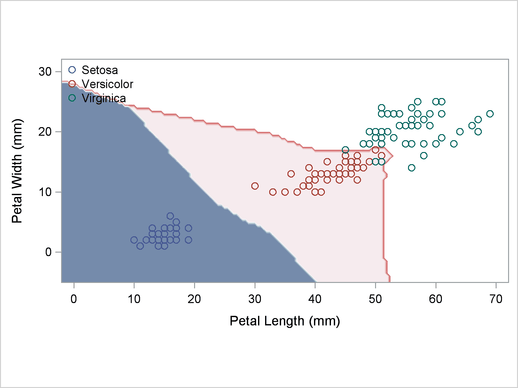
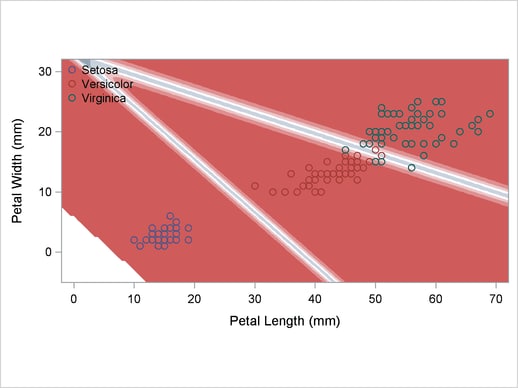
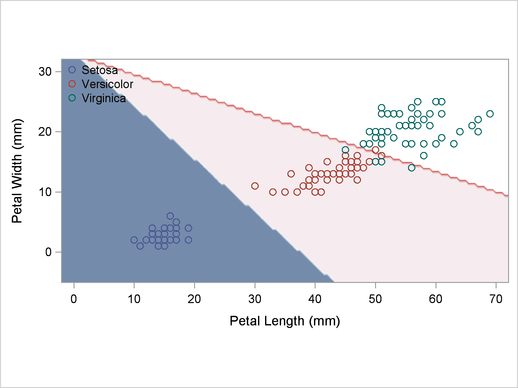
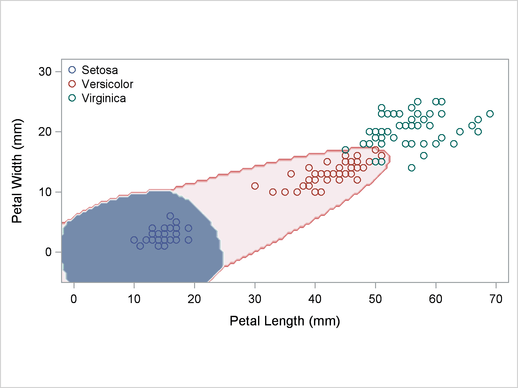
A normal-theory analysis (METHOD=NORMAL) assuming equal covariance matrices (POOL=YES) illustrates the linearity of the classification boundaries. These statements produce Output 32.2.2:
title2 'Using Normal Density Estimates with Equal Variance';

proc discrim data=sashelp.iris method=normal pool=yes
             testdata=plotdata testout=plotp testoutd=plotd
             short noclassify crosslisterr;
   class Species;
   var Petal:;
run;

%contden
%contprob
%contclass
Output 32.2.2
Normal Density Estimates with Equal Variance
| Setosa |
50 |
50.0000 |
0.333333 |
0.333333 |
| Versicolor |
50 |
50.0000 |
0.333333 |
0.333333 |
| Virginica |
50 |
50.0000 |
0.333333 |
0.333333 |
The DISCRIM Procedure
Classification Results for Calibration Data: SASHELP.IRIS
Cross-validation Results using Linear Discriminant Function
| * |
0.0000 |
0.2130 |
0.7870 |
| * |
0.0000 |
0.3118 |
0.6882 |
| * |
0.0000 |
0.8453 |
0.1547 |
| * |
0.0000 |
0.8322 |
0.1678 |
| * |
0.0000 |
0.8057 |
0.1943 |
| * |
0.0000 |
0.8903 |
0.1097 |
* Misclassified observation
The DISCRIM Procedure
Classification Summary for Calibration Data: SASHELP.IRIS
Cross-validation Summary using Linear Discriminant Function
| 0.0000 |
0.0400 |
0.0800 |
0.0400 |
| 0.3333 |
0.3333 |
0.3333 |
|
The DISCRIM Procedure
Classification Summary for Test Data: WORK.PLOTDATA
Classification Summary using Linear Discriminant Function
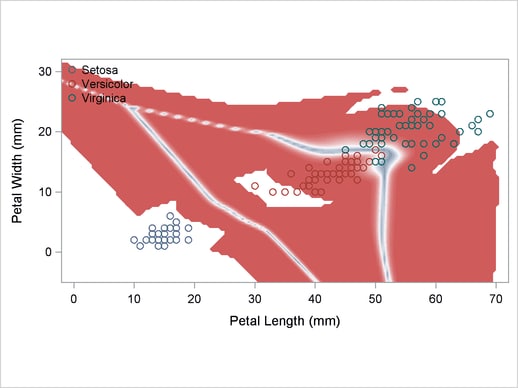
A normal-theory analysis assuming unequal covariance matrices (POOL=NO) illustrates quadratic classification boundaries. These statements produce Output 32.2.3:
title2 'Using Normal Density Estimates with Unequal Variance';

proc discrim data=sashelp.iris method=normal pool=no
             testdata=plotdata testout=plotp testoutd=plotd
             short noclassify crosslisterr;
   class Species;
   var Petal:;
run;

%contden
%contprob
%contclass
Output 32.2.3
Normal Density Estimates with Unequal Variance
| Setosa |
50 |
50.0000 |
0.333333 |
0.333333 |
| Versicolor |
50 |
50.0000 |
0.333333 |
0.333333 |
| Virginica |
50 |
50.0000 |
0.333333 |
0.333333 |
The DISCRIM Procedure
Classification Results for Calibration Data: SASHELP.IRIS
Cross-validation Results using Quadratic Discriminant Function
| * |
0.0000 |
0.0903 |
0.9097 |
| * |
0.0000 |
0.4675 |
0.5325 |
| * |
0.0000 |
0.7288 |
0.2712 |
| * |
0.0000 |
0.5196 |
0.4804 |
| * |
0.0000 |
0.8335 |
0.1665 |
* Misclassified observation
The DISCRIM Procedure
Classification Summary for Calibration Data: SASHELP.IRIS
Cross-validation Summary using Quadratic Discriminant Function
| 0.0000 |
0.0400 |
0.0600 |
0.0333 |
| 0.3333 |
0.3333 |
0.3333 |
|
The DISCRIM Procedure
Classification Summary for Test Data: WORK.PLOTDATA
Classification Summary using Quadratic Discriminant Function
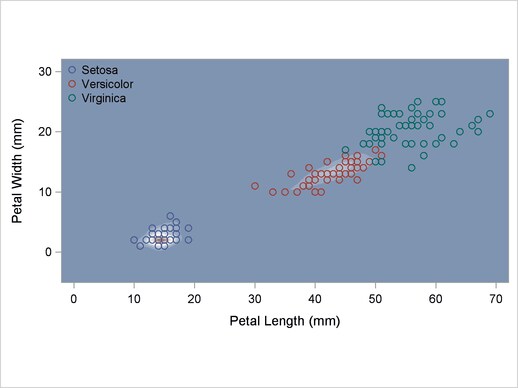
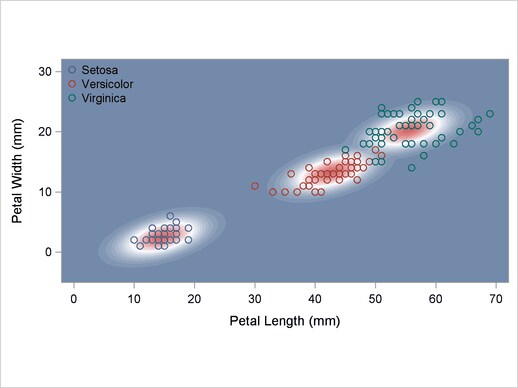
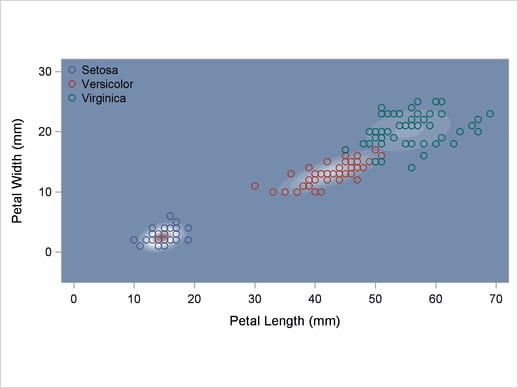
A nonparametric analysis (METHOD=NPAR) follows, using normal kernels (KERNEL=NORMAL) and equal bandwidths (POOL=YES) in each class. The value of the radius parameter r that, assuming normality, minimizes an approximate mean integrated square error is  (see the section Nonparametric Methods). These statements produce Output 32.2.4:
title2 'Using Kernel Density Estimates with Equal Bandwidth';

proc discrim data=sashelp.iris method=npar kernel=normal
             r=.5 pool=yes testoutd=plotd
             testdata=plotdata testout=plotp
             short noclassify crosslisterr;
   class Species;
   var Petal:;
run;

%contden
%contprob
%contclass
Output 32.2.4
Kernel Density Estimates with Equal Bandwidth
| Setosa |
50 |
50.0000 |
0.333333 |
0.333333 |
| Versicolor |
50 |
50.0000 |
0.333333 |
0.333333 |
| Virginica |
50 |
50.0000 |
0.333333 |
0.333333 |
The DISCRIM Procedure
Classification Results for Calibration Data: SASHELP.IRIS
Cross-validation Results using Normal Kernel Density
| * |
0.0000 |
0.0800 |
0.9200 |
| * |
0.0000 |
0.4123 |
0.5877 |
| * |
0.0000 |
0.7474 |
0.2526 |
| * |
0.0000 |
0.5863 |
0.4137 |
| * |
0.0000 |
0.8358 |
0.1642 |
* Misclassified observation
The DISCRIM Procedure
Classification Summary for Calibration Data: SASHELP.IRIS
Cross-validation Summary using Normal Kernel Density
| 0.0000 |
0.0400 |
0.0600 |
0.0333 |
| 0.3333 |
0.3333 |
0.3333 |
|
The DISCRIM Procedure
Classification Summary for Test Data: WORK.PLOTDATA
Classification Summary using Normal Kernel Density
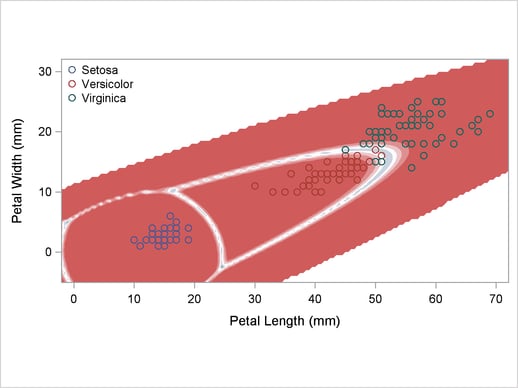
Another nonparametric analysis is run with unequal bandwidths (POOL=NO). These statements produce Output 32.2.5:
title2 'Using Kernel Density Estimates with Unequal Bandwidth';

proc discrim data=sashelp.iris method=npar kernel=normal
             r=.5 pool=no testoutd=plotd
             testdata=plotdata testout=plotp
             short noclassify crosslisterr;
   class Species;
   var Petal:;
run;

%contden
%contprob
%contclass
Output 32.2.5
Kernel Density Estimates with Unequal Bandwidth
| Setosa |
50 |
50.0000 |
0.333333 |
0.333333 |
| Versicolor |
50 |
50.0000 |
0.333333 |
0.333333 |
| Virginica |
50 |
50.0000 |
0.333333 |
0.333333 |
The DISCRIM Procedure
Classification Results for Calibration Data: SASHELP.IRIS
Cross-validation Results using Normal Kernel Density
| * |
0.0000 |
0.0516 |
0.9484 |
| * |
0.0000 |
0.3773 |
0.6227 |
| * |
0.0000 |
0.7826 |
0.2174 |
| * |
0.0000 |
0.8802 |
0.1198 |
* Misclassified observation
The DISCRIM Procedure
Classification Summary for Calibration Data: SASHELP.IRIS
Cross-validation Summary using Normal Kernel Density
| 0.0000 |
0.0400 |
0.0400 |
0.0267 |
| 0.3333 |
0.3333 |
0.3333 |
|
The DISCRIM Procedure
Classification Summary for Test Data: WORK.PLOTDATA
Classification Summary using Normal Kernel Density
 (see the section Nonparametric Methods). These statements produce Output 32.2.4: