| Creating and Editing PSS Projects |
A PSS project is an instance of an analysis. The first decision in using PSS is to choose the appropriate test or design. Select the File New on the menu bar or click the New icon on the toolbar. The New window appears with a list of the available analyses. Select the type of analysis that you want from the list and click OK.
When the project is first opened, the Edit Properties page is displayed. It is described in the section Editing Properties.
After the properties have been specified and the analysis is performed, the View Results page is displayed. See the section Viewing the Results.
A project that has been saved and closed can be reopened from the Open window. Select FileOpen on the menu bar or click the Open icon on the toolbar.
Editing Properties
The Edit Properties page consists of several analysis options and input parameters that are relevant to the particular analysis. These options and parameters are organized on several tabs, as shown in Figure 71.27.
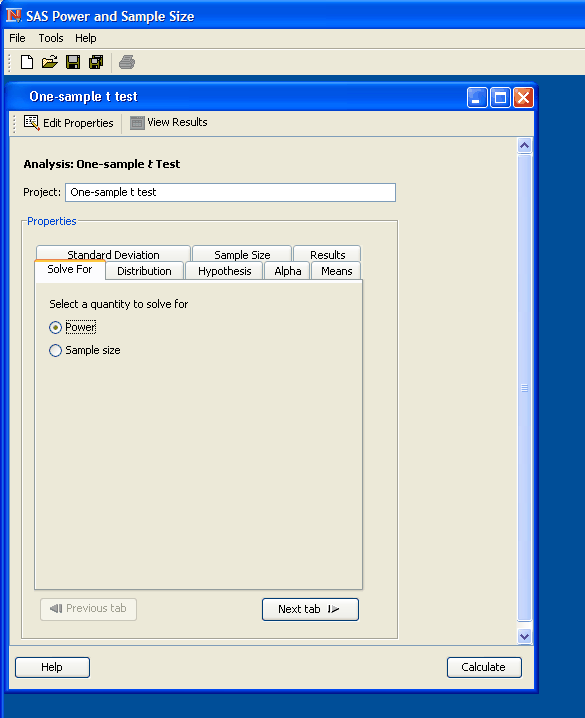
The Edit Properties page contains various controls by which you can enter values or select choices. In addition to the usual data entry controls such as text fields and check boxes, several specialized controls are present: data entry tables and the Alternate Forms control. More detailed descriptions follow.
Using Data Tables
Data entry tables are composed of data entry fields for one or more rows and columns. Figure 71.28 shows a two-row, two-column table.
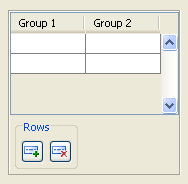
Type an appropriate value in each field. It is not necessary to type data in all rows or to delete empty rows. However, if a table has more than one column, the cells of a row must be completely filled or completely blank. Rows with values in some but not all cells are not allowed.
To append more rows, click the  button beneath the table. To delete the last row of the table, click the
  button.
Also, you can display a pop-up menu to perform additional actions such as inserting and deleting rows. First, select the row to insert before or delete, then right-click to display the pop-menu and select the desired action.
Using Alternate Forms
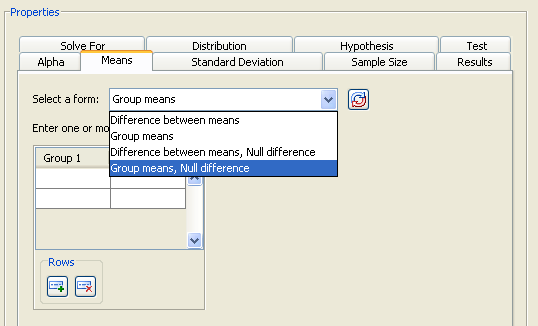
For some input parameters, there are several ways in which data may be entered. For example, in the two-sample t test analysis, group means can be entered as either individual means or a difference between means.
The alternate forms are displayed in a drop-down list with an adjacent  button, as shown in Figure 71.29. The button enables you to cycle through the alternatives, displaying each one in turn. To see what forms are available, you can open the drop-down list and select the one you want or you can click the button until the form that you want is displayed.
The alternate form last used for an analysis is saved and displayed as the default when a new instance of the analysis is opened.
Customizing Graphs
The Edit Properties page for all analyses contains a Results tab. You can choose to create a graph, and you can optionally choose to customize the graph by clicking the Customize button that is beside the Create power and sample size graph choice.
As shown in Figure 71.30, the Customize Graph window consists of an Axis Orientation tab and a Value Ranges tab. Use the Axis Orientation options to specify which axes you want used for power and for sample size. Use the Value Ranges settings to specify the axis range for the non-target quantity (that is, the power axis if you are solving for sample size or the sample size axis if you are solving for power).
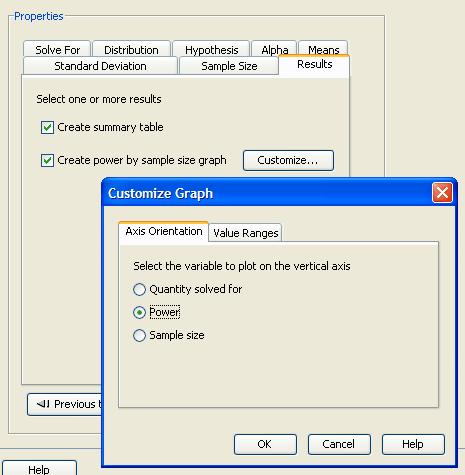
When specifying a value range, you can specify a minimum value and a maximum value. Also, you can select either the Number of points or the Interval between points choice for the axis and specify a value. All of these values are optional; specify only the ones you want.
Scenarios
A scenario is one instance of a complete set of values for an analysis. For example, if two alpha values and two total sample size values are specified with all other input parameters taking only a single value, there would be four scenarios—the four combinations of two alphas and two sample sizes.
Viewing the Results
The results appear in separate tabs on the View Results Page. These tabs include Summary Table, Graph, Narratives, SAS Log, and SAS Code.
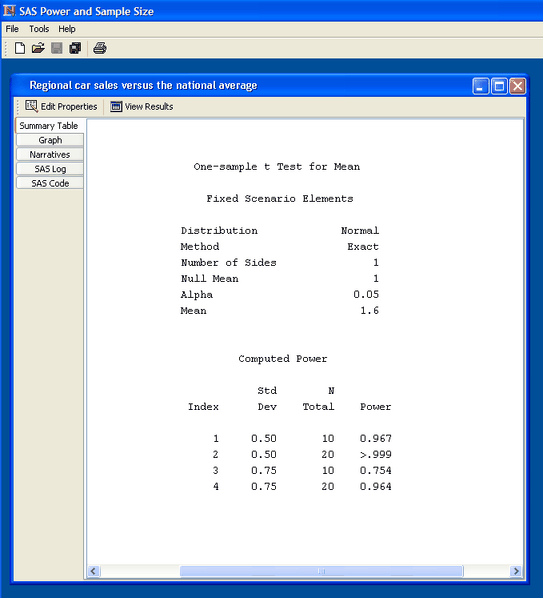
Viewing the Summary Table
Click the Summary Table tab to view the summary table. It consists of two subtables, as shown in Figure 71.31. The Fixed Scenario Elements table includes the options and parameter values that are constant for the analysis. The Computed Power table includes the calculated power or sample size values and the values for input parameters that have multiple values specified for the analysis.
Creating Narratives
Click the Narratives tab to display a facility to create narratives. Narratives are descriptions of the input parameter values and calculated quantities in sentence or paragraph form. Each narrative corresponds to one calculated quantity value.
The Narratives tab is divided into a narrative selector panel and a narrative display panel. To create a narrative, select the row in the narrative selector panel that corresponds to it. You can select as many rows as you want. See Figure 71.32.
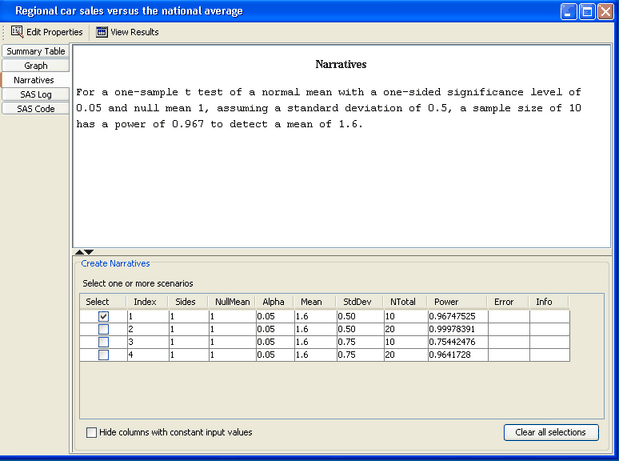
The narrative selector table often contains columns whose values do not vary. For example, in Figure 71.32, the Sides, NullMean, Alpha, and Mean columns contain values that do not vary. You can hide these columns by selecting the Hide columns with constant input values check box.
Viewing the SAS Log and Code
Click the SAS Code tab to view the SAS statements that are used to generate the analysis results. Click the SAS Log tab to view the SAS log that corresponds to the analysis.
The SAS code differs slightly from the statements in the SAS log. Statements that are used to place the results in the location maintained by the application are not included. This is done to prevent you from overwriting the results stored by the application if you run the SAS code outside of the application.
Printing Results
To print one or more results, click the Print icon on the toolbar or select FilePrint on the menu bar. The Select Results to Print window is displayed. You can choose to print one or more of the results by selecting the corresponding options here.
Saving the Project
To save a project, click the Save toolbar icon or select FileSave from the menu bar. Projects can be saved even if some of the information is invalid. Error checking is performed when the Calculate button is clicked.
Closing the Project
To close a project, click the X in the upper right corner of the project window or select FileClose from the menu bar.