The BOXPLOT Procedure

| Styles of Box Plots |
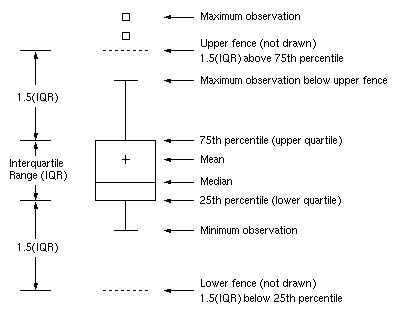
A box-and-whiskers plot is displayed for the measurements in each group on the box plot. The skeletal style of the box-and-whiskers plot shown in Figure 25.6 is the default. You can produce a schematic box plot by specifying the BOXSTYLE=SCHEMATIC option in the PLOT statement. Figure 25.8 illustrates a typical schematic box plot and the locations of the fences (which are not displayed in actual output). See the description of the BOXSTYLE= option for complete details.
You can draw connecting lines between adjacent box-and-whiskers plots by using the BOXCONNECT=keyword option. For example, BOXCONNECT=MEAN connects the points representing the means of adjacent groups. Other available keywords are MIN, Q1, MEDIAN, Q3, and MAX. Specifying BOXCONNECT without a keyword is equivalent to specifying BOXCONNECT=MEAN. You can specify the color for the connecting lines with the CCONNECT= option.