| The TRANSREG Procedure |
Example 91.1 Transformation Regression of Exhaust Emissions Data
In this example, the data are from an experiment in which nitrogen oxide emissions from a single cylinder engine are measured for various combinations of fuel, compression ratio, and equivalence ratio. The data are provided by Brinkman (1981).
The equivalence ratio and nitrogen oxide variables are continuous and numeric, so spline transformations of these variables are requested. The spline transformation of the dependent variable is restricted to be monotonic. Each spline is degree three with nine knots (one at each decile) in order to give PROC TRANSREG a great deal of freedom in finding transformations. The compression ratio variable has only five discrete values, so an optimal scoring is requested with monotonicity constraints. The character variable Fuel is nominal, so it is optimally scored without any monotonicity constraints. Observations with missing values are excluded with the NOMISS a-option. The following statements produce Output 91.1.1:
title 'Gasoline Example';

data Gas;
   input Fuel :$8. CpRatio EqRatio NOx @@;
   label Fuel    = 'Fuel'
         CpRatio = 'Compression Ratio (CR)'
         EqRatio = 'Equivalence Ratio (PHI)'
         NOx     = 'Nitrogen Oxide (NOx)';
   datalines;
Ethanol  12.0 0.907 3.741 Ethanol  12.0 0.761 2.295
Ethanol  12.0 1.108 1.498 Ethanol  12.0 1.016 2.881
Ethanol  12.0 1.189 0.760 Ethanol   9.0 1.001 3.120

   ... more lines ...

94%Eth    7.5 1.075 2.147
;
ods graphics on;

title2 'Iteratively Estimate NOx, CpRatio, EqRatio, and Fuel';

* Fit the Nonparametric Model;
proc transreg data=Gas solve test nomiss plots=all;
   ods exclude where=(_path_ ? 'MV');
   model mspline(NOx / nknots=9) = spline(EqRatio / nknots=9)
                                   monotone(CpRatio) opscore(Fuel);
run;
| Gasoline Example |
| Iteratively Estimate NOx, CpRatio, EqRatio, and Fuel |
Nitrogen Oxide (NOx)
| Number of Observations Read | 171 |
|---|---|
| Number of Observations Used | 169 |
| TRANSREG MORALS Algorithm Iteration History for Mspline(NOx) | |||||
|---|---|---|---|---|---|
| Iteration Number |
Average Change |
Maximum Change |
R-Square | Criterion Change |
Note |
| 0 | 0.41900 | 3.80550 | 0.05241 | ||
| 1 | 0.11984 | 0.83327 | 0.91028 | 0.85787 | |
| 2 | 0.03727 | 0.17688 | 0.93981 | 0.02953 | |
| 3 | 0.02795 | 0.10880 | 0.94969 | 0.00987 | |
| 4 | 0.02088 | 0.07279 | 0.95382 | 0.00413 | |
| 5 | 0.01530 | 0.05031 | 0.95582 | 0.00201 | |
| 6 | 0.01130 | 0.03922 | 0.95688 | 0.00106 | |
| 7 | 0.00852 | 0.03197 | 0.95748 | 0.00060 | |
| 8 | 0.00657 | 0.02531 | 0.95783 | 0.00035 | |
| 9 | 0.00510 | 0.01975 | 0.95805 | 0.00022 | |
| 10 | 0.00398 | 0.01534 | 0.95818 | 0.00013 | |
| 11 | 0.00314 | 0.01200 | 0.95827 | 0.00009 | |
| 12 | 0.00250 | 0.00953 | 0.95832 | 0.00005 | |
| 13 | 0.00199 | 0.00752 | 0.95836 | 0.00003 | |
| 14 | 0.00159 | 0.00594 | 0.95838 | 0.00002 | |
| 15 | 0.00127 | 0.00470 | 0.95839 | 0.00001 | |
| 16 | 0.00102 | 0.00373 | 0.95840 | 0.00001 | |
| 17 | 0.00081 | 0.00297 | 0.95841 | 0.00001 | |
| 18 | 0.00065 | 0.00237 | 0.95841 | 0.00000 | |
| 19 | 0.00052 | 0.00189 | 0.95841 | 0.00000 | |
| 20 | 0.00042 | 0.00151 | 0.95842 | 0.00000 | |
| 21 | 0.00033 | 0.00120 | 0.95842 | 0.00000 | |
| 22 | 0.00027 | 0.00096 | 0.95842 | 0.00000 | |
| 23 | 0.00021 | 0.00077 | 0.95842 | 0.00000 | |
| 24 | 0.00017 | 0.00061 | 0.95842 | 0.00000 | |
| 25 | 0.00014 | 0.00049 | 0.95842 | 0.00000 | |
| 26 | 0.00011 | 0.00039 | 0.95842 | 0.00000 | |
| 27 | 0.00009 | 0.00031 | 0.95842 | 0.00000 | |
| 28 | 0.00007 | 0.00025 | 0.95842 | 0.00000 | |
| 29 | 0.00006 | 0.00020 | 0.95842 | 0.00000 | |
| 30 | 0.00005 | 0.00016 | 0.95842 | 0.00000 | Not Converged |
Nitrogen Oxide (NOx)
| Univariate ANOVA Table Based on the Usual Degrees of Freedom | |||||
|---|---|---|---|---|---|
| Source | DF | Sum of Squares | Mean Square | F Value | Liberal p |
| Model | 21 | 326.0176 | 15.52465 | 161.35 | >= <.0001 |
| Error | 147 | 14.1443 | 0.09622 | ||
| Corrected Total | 168 | 340.1619 | |||
| The above statistics are not adjusted for the fact that the dependent variable was transformed and so are generally liberal. | |||||
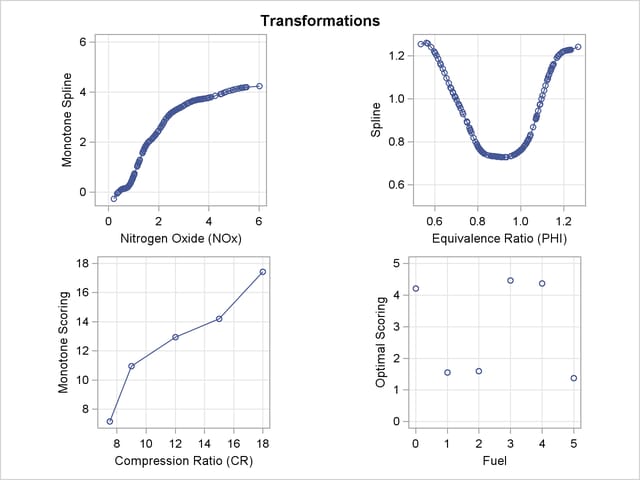
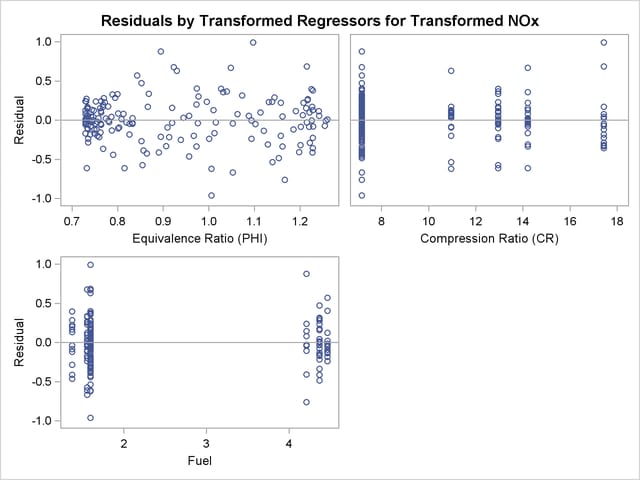
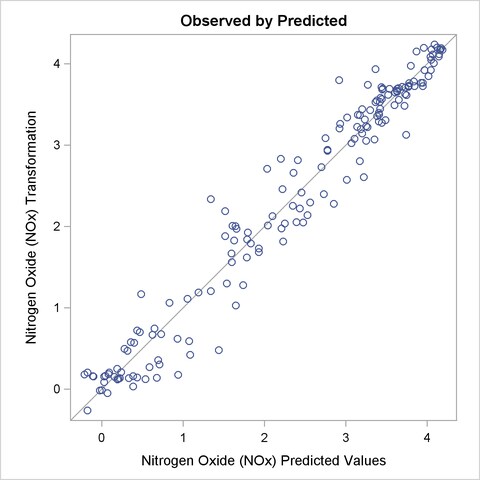
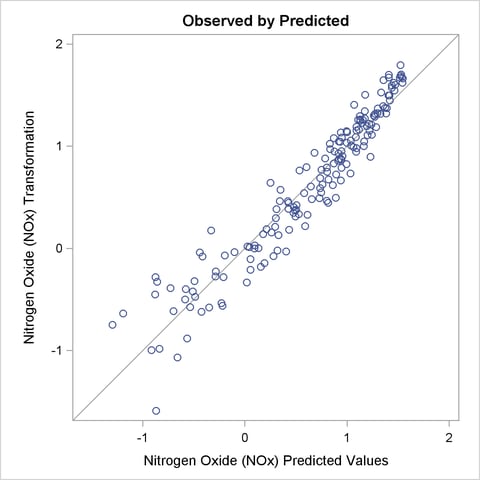
The squared multiple correlation for the initial model is approximately 0.05. PROC TRANSREG increases the R square to over 0.95 by transforming the variables. The transformation plots show how each variable is transformed. The transformation of compression ratio (TCpRatio) is nearly linear. The transformation of equivalence ratio (TEqRatio) is nearly parabolic. It can be seen from this plot that the optimal transformation of equivalence ratio is nearly uncorrelated with the original scoring. This suggests that the large increase in R square is due to this transformation. The transformation of nitrogen oxide (TNOx) is similar to a log transformation. The final plot shows the transformed dependent variable plotted as a function of the predicted values. This plot is reasonably linear, showing that the nonlinearities in the data are being accounted for fairly well by the TRANSREG model.
These results suggest the parametric model
You can perform this analysis with PROC TRANSREG. The following statements produce Output 91.1.2:
title2 'Now fit log(NOx) = b0 + b1*EqRatio + b2*EqRatio**2 +';
title3 'b3*CpRatio + Sum b(j)*Fuel(j) + Error';

*-Fit the Parametric Model Suggested by the Nonparametric Analysis-;
proc transreg data=Gas solve ss2 short nomiss plots=all;
   model log(NOx) = pspline(EqRatio / deg=2) identity(CpRatio)
                    opscore(Fuel);
run;

ods graphics off;
| Gasoline Example |
| Now fit log(NOx) = b0 + b1*EqRatio + b2*EqRatio**2 + |
| b3*CpRatio + Sum b(j)*Fuel(j) + Error |
Nitrogen Oxide (NOx)
| Number of Observations Read | 171 |
|---|---|
| Number of Observations Used | 169 |
Nitrogen Oxide (NOx)
| Univariate ANOVA Table Based on the Usual Degrees of Freedom | |||||
|---|---|---|---|---|---|
| Source | DF | Sum of Squares | Mean Square | F Value | Pr > F |
| Model | 8 | 79.33838 | 9.917298 | 213.09 | <.0001 |
| Error | 160 | 7.44659 | 0.046541 | ||
| Corrected Total | 168 | 86.78498 | |||
| Univariate Regression Table Based on the Usual Degrees of Freedom | |||||||
|---|---|---|---|---|---|---|---|
| Variable | DF | Coefficient | Type II Sum of Squares |
Mean Square | F Value | Pr > F | Label |
| Intercept | 1 | -15.274649 | 57.1338 | 57.1338 | 1227.60 | <.0001 | Intercept |
| Pspline.EqRatio_1 | 1 | 35.102914 | 62.7478 | 62.7478 | 1348.22 | <.0001 | Equivalence Ratio (PHI) 1 |
| Pspline.EqRatio_2 | 1 | -19.386468 | 64.6430 | 64.6430 | 1388.94 | <.0001 | Equivalence Ratio (PHI) 2 |
| Identity(CpRatio) | 1 | 0.032058 | 1.4445 | 1.4445 | 31.04 | <.0001 | Compression Ratio (CR) |
| Opscore(Fuel) | 5 | 0.158388 | 5.5619 | 1.1124 | 23.90 | <.0001 | Fuel |
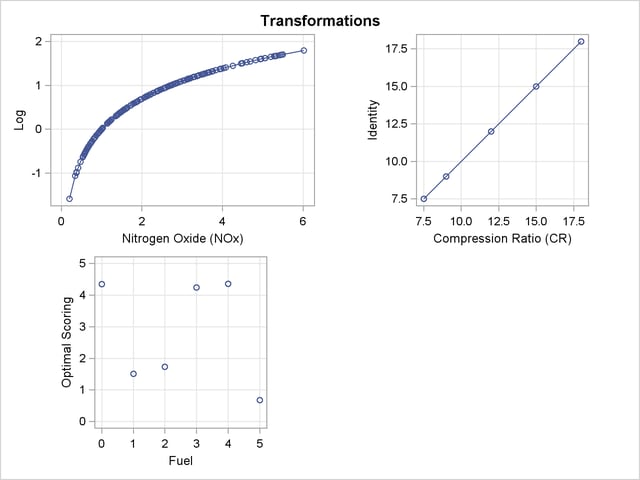
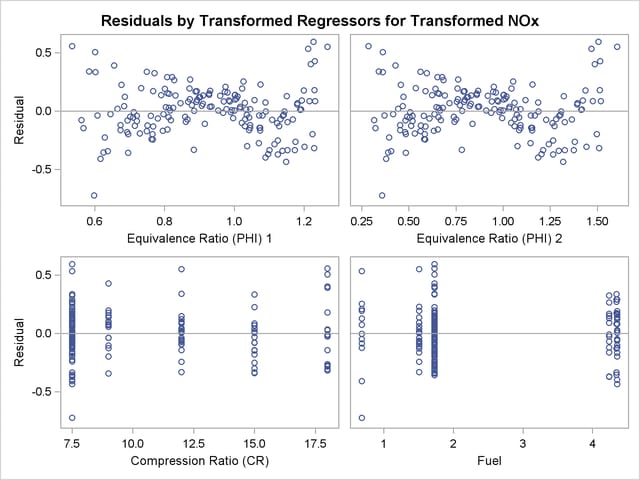
The LOG transformation computes the natural log. The PSPLINE expansion expands EqRatio into a linear term, EqRatio, and a squared term, ![]() . An identity transformation of CpRatio and an optimal scoring of Fuel is requested. These should provide a good parametric operationalization of the optimal transformations. The final model has an R square of 0.91 (smaller than before since the model has fewer parameters, but still quite good).
. An identity transformation of CpRatio and an optimal scoring of Fuel is requested. These should provide a good parametric operationalization of the optimal transformations. The final model has an R square of 0.91 (smaller than before since the model has fewer parameters, but still quite good).
Copyright © SAS Institute, Inc. All Rights Reserved.