| The SEQDESIGN Procedure |
| Boundaries for Group Sequential Designs |
A one-sided test is a test of a hypothesis with either a lower alternative ( ) or an upper alternative (
 ), and a two-sided test is a test with a two-sided alternative (
 ). The number of critical values for a test depends on whether the alternative is one-sided or two-sided, and it also depends on whether the trial is conducted with a fixed-sample design or a group sequential design.
For a fixed-sample trial, a one-sided test has one critical value and a two-sided test has two critical values. These critical values are computed with the specified Type I error probability  . In contrast, at each interim stage of a group sequential trial, a one-sided test has up to two critical values and a two-sided group sequential test has up to four critical values. Thus, there are two or four possible boundaries for a group sequential design, and each boundary is a set of critical values, one from each stage.
Figure 78.3 illustrates the boundaries for a one-sided test with an upper alternative that allows for early stopping to either reject or accept the null hypothesis.
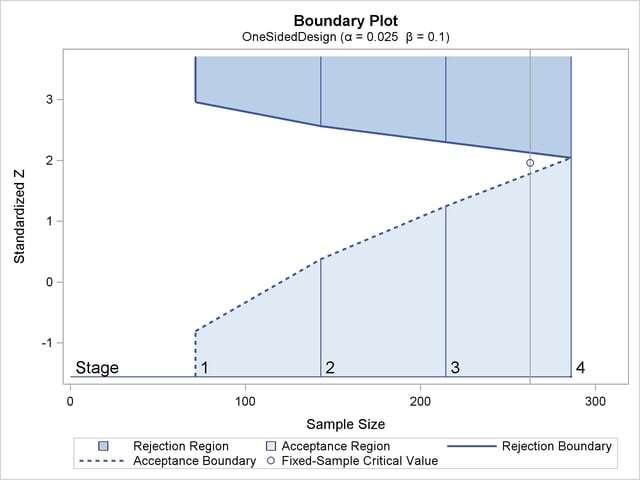
With an upper alternative, as in this example, the design has the following two boundaries: an upper (rejection) boundary for the rejection region that consists of upper rejection critical values and an upper  (acceptance) boundary for the acceptance region that consists of upper acceptance critical values. The stages are indicated by vertical lines with accompanying stage numbers. In Figure 78.3, the horizontal axis indicates the cumulative sample size for the group sequential trial. The vertical axis indicates the critical values at each stage on the standardized
  scale. Other scales can be used for the vertical axis, including the MLE scale, score statistic scale, and
  -value scale.
At each interim stage, if the test statistic is in the rejection region (darker shaded area in Figure 78.3), the trial stops and the null hypothesis is rejected. If the test statistic is in the acceptance region (lightly shaded area in Figure 78.3), the trial stops and the hypothesis is accepted. Otherwise, the trial continues to the next stage. If the trial proceeds to the final stage (stage  ), the upper and upper critical values are identical, and the trial stops to either reject or accept the null hypothesis.
Copyright © SAS Institute, Inc. All Rights Reserved.