| Statistical Graphics Using ODS |
| Some Common Style Elements |
The DEFAULT style is the parent for the styles used for statistical graphics work. You can see all of the elements of the DEFAULT style by running the following step:
proc template;
   source styles.default;
run;
The source listing of the definition of the DEFAULT style is hundreds of lines long. If you run PROC TEMPLATE with the SOURCE statement for most other styles, you see parent = styles.default, and you do not see all of the elements in the style unless you also run the preceding step.
Only a few of the style elements are referenced in the templates that the SAS System provides for statistical procedures. The most commonly used style elements, along with the defaults for the noncolor attributes of the DEFAULT style, are shown next (Color applies to filled areas, and ContrastColor applies to markers and lines):
Graph |
graph size, outer border appearance, and background color |
Padding = 0 |
|
BackgroundColor |
|
GraphConfidence |
graph size, outer border appearance, and background color |
LineThickness = 1px |
|
LineStyle = 1 |
|
MarkerSize = 7px |
|
MarkerSymbol = "triangle" |
|
ContrastColor |
|
Color |
|
GraphData1 |
attributes related to first grouped data items |
MarkerSymbol = "circle" |
|
LineStyle = 1 |
|
ContrastColor |
|
Color |
|
GraphData2 |
attributes related to second grouped data items |
MarkerSymbol = "plus" |
|
LineStyle = 4 |
|
ContrastColor |
|
Color |
|
GraphData3 |
attributes related to third grouped data items |
MarkerSymbol = "X" |
|
LineStyle = 8 |
|
ContrastColor |
|
Color |
|
GraphData4 |
attributes related to fourth grouped data items |
MarkerSymbol = "triangle" |
|
LineStyle = 5 |
|
ContrastColor |
|
Color |
|
GraphDatan |
attributes related to nth grouped data items |
MarkerSymbol |
|
LineStyle |
|
ContrastColor |
|
Color |
|
|
attributes related to non-grouped data items |
EndColor |
|
NeutralColor |
|
StartColor |
|
MarkerSize = 7px |
|
MarkerSymbol = "circle" |
|
LineThickness = 1px |
|
LineStyle = 1 |
|
ContrastColor |
|
Color |
|
GraphFit |
primary fit line, such as a normal density curve |
LineThickness = 2px |
|
LineStyle = 1 |
|
MarkerSize = 7px |
|
MarkerSymbol = "circle" |
|
ContrastColor |
|
Color |
|
GraphFit2 |
secondary fit line, such as a kernel density curve |
LineThickness = 2px |
|
LineStyle = 4 |
|
MarkerSize = 7px |
|
MarkerSymbol = "X" |
|
ContrastColor |
|
Color |
|
GraphGridLines |
horizontal and vertical grid lines drawn at major tick marks |
Displayopts = "auto" |
|
LineThickness = 1px |
|
LineStyle = 1 |
|
ContrastColor |
|
Color |
|
GraphOutlier |
outlier data for the graph |
LineThickness = 2px |
|
LineStyle = 42 |
|
MarkerSize = 7px |
|
MarkerSymbol = "circle" |
|
ContrastColor |
|
Color |
|
GraphPredictionLimits |
fills for prediction limits |
LineThickness = 1px |
|
LineStyle = 2 |
|
MarkerSize = 7px |
|
MarkerSymbol = "chain" |
|
ContrastColor |
|
Color |
|
|
horizontal and vertical reference lines and drop lines |
LineThickness = 1px |
|
LineStyle = 1 |
|
ContrastColor |
|
GraphDataText |
text font and color for point and line labels |
Font = GraphFonts(’GraphDataFont’) |
|
(where ’GraphDataFont’ = |
|
("<sans-serif>, <MTsans-serif>",7pt)) |
|
Color |
|
GraphValueText |
text font and color for axis tick values and legend values |
Font = GraphFonts(’GraphValueFont’) |
|
(where ’GraphValueFont’ = |
|
("<sans-serif>, <MTsans-serif>",9pt)) |
|
Color |
|
GraphLabelText |
text font and color for axis labels and legend title |
Font = GraphFonts(’GraphLabelFont’) |
|
(where ’GraphLabelFont’ = |
|
("<sans-serif>, <MTsans-serif>",10pt,bold)) |
|
Color |
|
GraphFootnoteText |
text font and color for footnote(s) |
Font = GraphFonts(’GraphFootnoteFont’) |
|
(where ’GraphFootnoteFont’ = |
|
("<sans-serif>, <MTsans-serif>",10pt)) |
|
Color |
|
GraphTitleText |
text font and color for title(s) |
Font = GraphFonts(’GraphTitleFont’) |
|
(where ’GraphTitleFont’ = ("<sans-serif>, |
|
<MTsans-serif>",11pt,bold)) |
|
Color |
|
GraphWalls |
vertical wall(s) bounded by axes |
LineThickness = 1px |
|
LineStyle = 1 |
|
FrameBorder = on |
|
ContrastColor |
|
BackgroundColor |
|
Color |
You refer to these elements in graph templates as style-element or as style-element:attribute (for example GraphDataDefault:ContrastColor). The default values are not shown for the color attributes since they are typically defined indirectly. For example, Graph:BackgroundColor (the color that fills the box outside the graph) is defined elsewhere in the style as colors(’docbg’). The style also defines: ’docbg’ = color_list(’bgA’) and ’bgA’ = cxE0E0E0. This shows that the background is a shade of gray that is much closer to white (CXFFFFFF) than to black (CX000000). You can see the background color in Figure 21.22. This shade of gray might seem darker (closer to CX000000) than you might expect based on just the RGB values. Your perception of a color change is not a linear function of the change in RGB values.
You can use the following program to see the color and other attributes for a number of style elements:
proc format; value vf 5 = 'GraphValueText'; run;

data x;
   array y[20] y0 - y19;
   do x = 1 to 20; y[x] = x - 0.5; end;
   do x = 0 to 10 by 5; output; end;
   label y0 = 'GraphLabelText' x = 'GraphLabelText';
   format x y0 vf.;
run;

%macro d;
   %do i = 1 %to 12;
      reg y=y%eval(19-&i) x=x / lineattrs=GraphData&i markerattrs=GraphData&i
                                curvelabel="  GraphData&i" curvelabelpos=max;
   %end;
%mend;

%macro l(i, l);
   reg y=y&i x=x / lineattrs=&l markerattrs=&l curvelabel="  &l"
                   curvelabelpos=max;
%mend;

ods listing style=default;

proc sgplot noautolegend;
   title 'GraphTitleText';
   %d
   %l(19, GraphDataDefault)
   %l( 6, GraphFit)
   %l( 5, GraphFit2)
   %l( 4, GraphPredictionLimits)
   %l( 3, GraphConfidence)
   %l( 2, GraphGridLines)
   %l( 1, GraphOutlier)
   %l( 0, GraphReference)
   xaxis values=(0 5 10);
run;
The results in Figure 21.22 display the attributes for a number of the elements of the DEFAULT style.
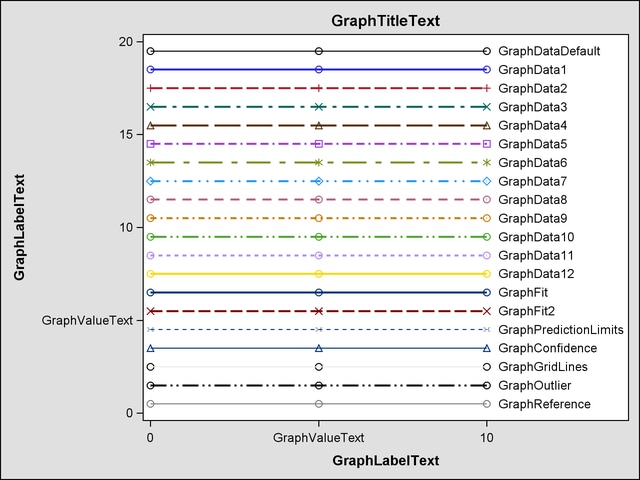
When there is a group or classification variable, the colors, markers, and lines that distinguish the groups are derived from the GraphDatan elements that are defined with the style. In the DEFAULT style, these are elements GraphData1 through GraphData12. There can be any number of groups even though only 12 GraphDatan style elements are defined in the DEFAULT style. The following steps create a data set with 40 groups, display one line per group, and produce Figure 21.23:
data x;
   do y = 40 to 1 by -1;
      group = 'Group' || put(41 - y, 2. -L);
      do x = 0 to 10 by 5;
         if x = 10 then do; z = 11; l = group; end;
         else           do; z = .;  l = ' ';   end;
         output;
      end;
   end;
run;
proc sgplot data=x;
   title 'Colors, Markers, Lines Patterns for Groups';
   series  y=y x=x / group=group markers;
   scatter y=y x=z / group=group markerchar=l;
run;
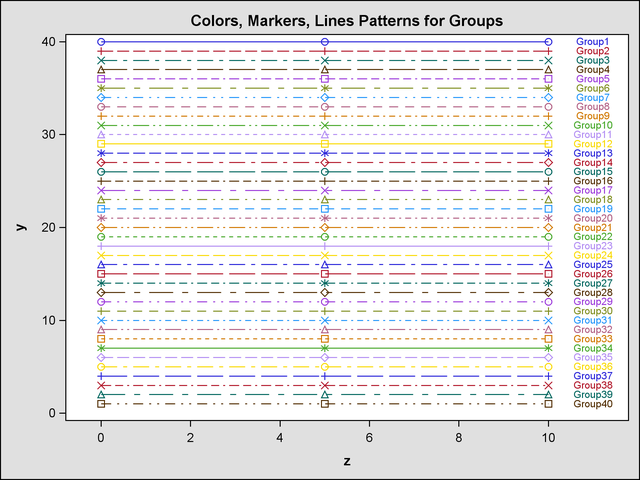
The colors, markers, and line patterns in Figure 21.23 repeat in cycles. The GraphData1 – GraphData8 lines in Figure 21.22 exactly match the Group1 – Group8 lines in Figure 21.23. After that, there are differences due to the cyclic construction of the grouped style definition. This is explained next.
The DEFAULT style defines a marker symbol only in GraphData1 through GraphData7. The seven markers are: circle, plus, X, triangle, square, asterisk, and diamond. With the explicit style reference in Figure 21.22, the actual symbol, when no symbol is specified, is the circle. This is what you see for GraphData8 through GraphData12. With the group variable in Figure 21.23, the symbols repeat in cycles. Hence, Group1, Group8, Group15, and so on, are all circles. Similarly, Group2, Group9, Group16, and so on, are all pluses. The DEFAULT style defines 11 different line styles for GraphData1 through GraphData11: 1, 4, 8, 5, 14, 26, 15, 20, 41, 42, and 2. Hence, Group1, Group12, Group23, and so on, all have the same line style, which is a solid line. Similarly, Group2, Group13, Group24, and so on, all have line style 4. There are twelve different colors, so Group1, Group13, Group25, and so on, all have the same colors. Overall, there are  color/line/marker combinations that appear before any combination repeats. You can use the %MODSTYLE SAS autocall macro (see the sections Creating an All-Color Style by Using the ModStyle Macro and Style Template Modification Macro) to conveniently change these style attributes.
Copyright © SAS Institute, Inc. All Rights Reserved.