| The NESTED Procedure |
| Reliability of Automobile Models |
A study is performed to compare the reliability of several models of automobiles. Three different automobile models (Model) from each of four U.S. automobile manufacturers (Make) are tested. Three different cars of each make and model are subjected to a reliability test and given a score between 1 and 100 (Score), where higher scores indicate greater reliability.
The following statements create the SAS data set auto.
title1 'Reliability of Automobile Models';
data auto;
   input Make $ Model Score @@;
   datalines;
a 1 62  a 2 77  a 3 59
a 1 67  a 2 73  a 3 64
a 1 60  a 2 79  a 3 60
b 1 72  b 2 58  b 3 80
b 1 75  b 2 63  b 3 84
b 1 69  b 2 57  b 3 89
c 1 94  c 2 76  c 3 81
c 1 90  c 2 75  c 3 85
c 1 88  c 2 78  c 3 85
d 1 69  d 2 73  d 3 90
d 1 72  d 2 88  d 3 87
d 1 76  d 2 87  d 3 92
;
The Make variable contains the make of the automobile, represented here by ‘a’, ‘b’, ‘c’, or ‘d’, while the Model variable represents the automobile model with a ‘1’, ‘2’, or ‘3’. The Score variable contains the reliability scores given to the three sampled cars from each Make-Model group. Since the automobile models are nested within their makes, the NESTED procedure is used to analyze these data. The NESTED procedure requires the data to be sorted by Make and, within Make, by Model, so the following statements execute a PROC SORT before completing the analysis.
proc sort data=auto;
   by Make Model;
run;

title1 'Reliability of Automobile Models';
proc nested data=auto;
   classes Make Model;
   var Score;
run;
The Model variable appears after the Make variable in the CLASS statement because it is nested within Make. The VAR statement specifies the response variable. The output is displayed in Figure 59.1.
| Reliability of Automobile Models |
| Coefficients of Expected Mean Squares |
|||
|---|---|---|---|
| Source | Make | Model | Error |
| Make | 9 | 3 | 1 |
| Model | 0 | 3 | 1 |
| Error | 0 | 0 | 1 |
| Nested Random Effects Analysis of Variance for Variable Score | ||||||||
|---|---|---|---|---|---|---|---|---|
| Variance Source | DF | Sum of Squares | F Value | Pr > F | Error Term | Mean Square | Variance Component | Percent of Total |
| Total | 35 | 4177.888889 | 119.368254 | 131.876543 | 100.0000 | |||
| Make | 3 | 1709.000000 | 2.15 | 0.1719 | Model | 569.666667 | 33.867284 | 25.6811 |
| Model | 8 | 2118.888889 | 18.16 | <.0001 | Error | 264.861111 | 83.425926 | 63.2606 |
| Error | 24 | 350.000000 | 14.583333 | 14.583333 | 11.0583 | |||
Figure 59.1 first displays the coefficients of the variance components that make up each of the expected mean squares, and then it displays the ANOVA table. The results do not indicate significant variation between the different automobile makes (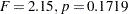 ). However, they do suggest that there is significant variation between the different models within the makes (
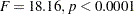 ). This is evident in the fact that the make of car accounts for only 25.7% of the total variation in the data, while the car model accounts for 63.3% (as shown in the Percent of Total column). The estimated variance components are shown in the Variance Component column.
Copyright © SAS Institute, Inc. All Rights Reserved.