| The KDE Procedure |
Example 45.1 Computing a Basic Kernel Density Estimate
This example illustrates the basic functionality of the UNIVAR statement. The effective channel length (in microns) is measured for 1225 field effect transistors. The channel lengths are saved as values of the variable length in a SAS data set named channel; refer to the file kdex1.sas in the SAS Sample Library. These statements create the channel data set:
data channel;
   input length @@;
datalines;
0.91 1.01 0.95 1.13 1.12 0.86 0.96 1.17 1.36 1.10
0.98 1.27 1.13 0.92 1.15 1.26 1.14 0.88 1.03 1.00
0.98 0.94 1.09 0.92 1.10 0.95 1.05 1.05 1.11 1.15

   ... more lines ...

2.13 2.05 1.90 2.07 2.15 1.96 2.15 1.89 2.15 2.04
1.95 1.93 2.22 1.74 1.91
;
The following statements request a kernel density estimate of the variable length:
ods graphics on;
proc kde data=channel;
   univar length;
run;
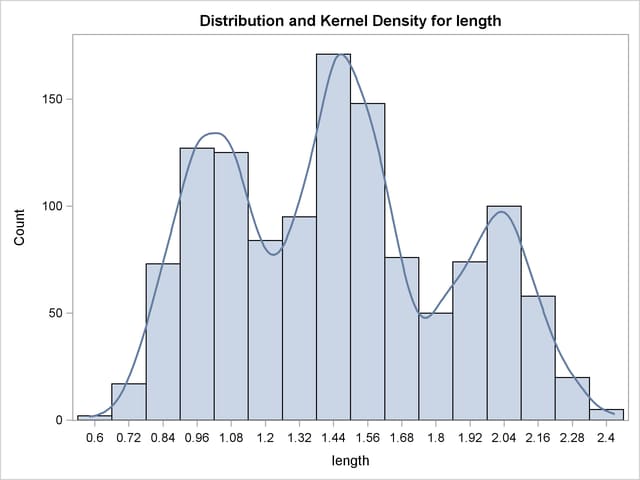
Because ODS Graphics is enabled, PROC KDE produces a histogram with an overlaid kernel density estimate by default, although the PLOTS= option is not specified. The resulting graph is shown in Output 45.1.1. For general information about ODS Graphics, see Chapter 21, Statistical Graphics Using ODS. For specific information about the graphics available in the KDE procedure, see the section ODS Graphics.

The default output tables for this analysis are the "Inputs" and "Controls" tables, shown in Output 45.1.2.
The "Inputs" table lists basic information about the density fit, including the input data set, the number of observations, the variable used, and the bandwidth method. The default bandwidth method is the Sheather-Jones plug-in.
The "Controls" table lists the primary numbers controlling the kernel density fit. Here the default number of grid points is used and no adjustment is made to the default bandwidth.
Copyright © SAS Institute, Inc. All Rights Reserved.