| The GENMOD Procedure |
| Exact Logistic and Poisson Regression |
The theory of exact logistic regression, also called exact conditional logistic regression, is described in the section Exact Conditional Logistic Regression of Chapter 51, The LOGISTIC Procedure. The following discussion of exact Poisson regression, also called exact conditional Poisson regression, uses the notation given in that section.
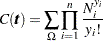
Note that in exact logistic regression, the coefficients  are the counts of the number of possible response vectors
  that generate
  :
: 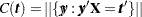 . However, when performing an exact Poisson regression, this value is replaced by
 |
where 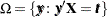 and
and  is the exponential of the offset
  for observation
  .
.
The probability density function (pdf) for  is created by summing over all binary sequences that generate an observable
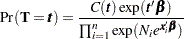 |
However, the conditional likelihood of  given
given  is the same as that for exact logistic regression.
For details about hypothesis testing and estimation, see the sections Hypothesis Tests and Inference for a Single Parameter of Chapter 51, The LOGISTIC Procedure. See the section Computational Resources for Exact Logistic Regression of Chapter 51, The LOGISTIC Procedure, for some computational notes about exact analyses.
The offset variable, , is required for exact Poisson regression computationally to provide an stopping point for the algorithm. Denote  . In exact logistic binary regression, there are a finite number,
  , of possible vectors to be considered. Since a Poisson-distributed response variable can take an infinite number of values, there is an infinite number of -vectors to be scanned. The offset variable reduces this number to
  response vectors. On a practical level, as
  gets large the probability of the Poisson random variable achieving this value drops to zero, so can be thought of as the point at which you believe the value does not matter. If you are modeling rates, then is the maximum possible value for each observation in the experiment; for example, if you are counting the number of rats in a cage that acquire a disease, then is the number of rats in cage . Finally, if you are conditioning out the intercept, and denoting the observed response as
  , every has an effective maximum of
  , which is the sufficient statistic for the intercept term.
OUTDIST= Output Data Set
The OUTDIST= data set contains every exact conditional distribution necessary to process the corresponding EXACT statement. For example, the following statements create one distribution for the x1 parameter and another for the x2 parameters, and produce the data set dist shown in Table 37.7:
data test;
   input y x1 x2 count;
   datalines;
0 0 0 1
1 0 0 1
0 1 1 2
1 1 1 1
1 0 2 3
1 1 2 1
1 2 0 3
1 2 1 2
1 2 2 1
;
proc genmod data=test exactonly;
   class x2 / param=ref;
   model y=x1 x2 / d=b;
   exact x1 x2/ outdist=dist;
proc print data=dist;
run;
Obs |
x1 |
x20 |
x21 |
Count |
Score |
Prob |
|---|---|---|---|---|---|---|
1 |
. |
0 |
0 |
3 |
5.81151 |
0.03333 |
2 |
. |
0 |
1 |
15 |
1.66031 |
0.16667 |
3 |
. |
0 |
2 |
9 |
3.12728 |
0.10000 |
4 |
. |
1 |
0 |
15 |
1.46523 |
0.16667 |
5 |
. |
1 |
1 |
18 |
0.21675 |
0.20000 |
6 |
. |
1 |
2 |
6 |
4.58644 |
0.06667 |
7 |
. |
2 |
0 |
19 |
1.61869 |
0.21111 |
8 |
. |
2 |
1 |
2 |
3.27293 |
0.02222 |
9 |
. |
3 |
0 |
3 |
6.27189 |
0.03333 |
10 |
2 |
. |
. |
6 |
3.03030 |
0.12000 |
11 |
3 |
. |
. |
12 |
0.75758 |
0.24000 |
12 |
4 |
. |
. |
11 |
0.00000 |
0.22000 |
13 |
5 |
. |
. |
18 |
0.75758 |
0.36000 |
14 |
6 |
. |
. |
3 |
3.03030 |
0.06000 |
The first nine observations in the dist data set contain an exact distribution for the parameters of the x2 effect (hence the values for the x1 parameter are missing), and the remaining five observations are for the x1 parameter. If a joint distribution was created, there would be observations with values for both the x1 and x2 parameters. For CLASS variables, the corresponding parameters in the dist data set are identified by concatenating the variable name with the appropriate classification level.
The data set contains the possible sufficient statistics of the parameters for the effects specified in the EXACT statement, and the Count variable contains the number of different responses that yield these statistics. In particular, there are six possible response vectors for which the dot product  was equal to 2, and for which
  ,
,  , and
, and  were equal to their actual observed values (displayed in the "Sufficient Statistics" table).
Note:If you are performing an exact Poisson analysis, then the Count variable is replaced by a variable named Weight.
When hypothesis tests are performed on the parameters, the Prob variable contains the probability of obtaining that statistic (which is just the count divided by the total count), and the Score variable contains the score for that statistic.
The OUTDIST= data set can contain a different exact conditional distribution for each specified EXACT statement. For example, consider the following EXACT statements:
exact 'O1'   x1    /           outdist=o1;
exact 'OJ12' x1 x2 / jointonly outdist=oj12;
exact 'OA12' x1 x2 / joint     outdist=oa12;
exact 'OE12' x1 x2 / estimate  outdist=oe12;
The O1 statement outputs a single exact conditional distribution. The OJ12 statement outputs only the joint distribution for x1 and x2. The OA12 statement outputs three conditional distributions: one for x1, one for x2, and one jointly for x1 and x2. The OE12 statement outputs two conditional distributions: one for x1 and the other for x2. Data set oe12 contains both the x1 and x2 variables; the distribution for x1 has missing values in the x2 column while the distribution for x2 has missing values in the x1 column.
Copyright © SAS Institute, Inc. All Rights Reserved.