| The ACECLUS Procedure |
| Background |
It is well known from the literature on nonparametric statistics that variances and, hence, covariances can be computed from pairwise differences instead of deviations from means. (For example, Puri and Sen (1971, pp. 51–52) show that the variance is a  statistic of degree 2.) Let
  be the data matrix with
  observations (rows) and
  variables (columns), and let
  be the mean of the
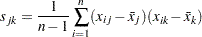
  th variable. The sample covariance matrix
  is usually defined as
 |
The matrix  can also be computed as
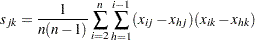 |
Let  be the pooled within-cluster covariance matrix,
  be the number of clusters,
  be the number of observations in the
  th cluster, and
 |
The matrix  is normally defined as
 |
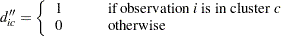
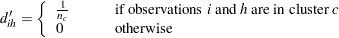
where  is the mean of the th variable in cluster . Let
 |
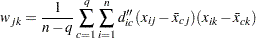
The matrix can also be computed as
 |
If the clusters are not known,  cannot be determined. However, an approximation to can be obtained by using instead
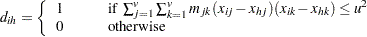 |
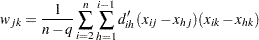
where  is an appropriately chosen value and
  is an appropriate metric. Let
  be defined as
 |
If all of the following conditions hold,  equals :
All within-cluster distances in the metric
 are less than or equal to .
 All between-cluster distances in the metric
are greater than . All clusters have the same number of members
.
If the clusters are of unequal size, gives more weight to large clusters than does, but this discrepancy should be of little importance if the population within-cluster covariance matrices are equal. There might be large differences between and if the cutoff does not discriminate between pairs in the same cluster and pairs in different clusters. Lack of discrimination might occur for one of the following reasons:
The clusters are not well separated.
The metric
or the cutoff is not chosen appropriately.
In the former case, little can be done to remedy the problem. The remaining question concerns how to choose and . Consider first. The best choice for is  , but is not known. The solution is to use an iterative algorithm:
Obtain an initial estimate of
, such as the identity or the total-sample covariance matrix. See the INITIAL= option in the PROC ACECLUS statement for more information. Let
equal  .
. Recompute
by using the preceding formula. Repeat steps 2 and 3 until the estimate stabilizes.
Convergence is assessed by comparing values of on successive iterations. Let  be the value of on the
  th iteration and
  be the initial estimate of . Let
  be a user-specified
  matrix. See the METRIC= option in the PROC ACECLUS statement for more information. The convergence measure is
 |
where  indicates the Euclidean norm—that is, the square root of the sum of the squares of the elements of the matrix. In PROC ACECLUS, can be the identity or an inverse factor of or diag(). Iteration stops when
  falls below a user-specified value. See the CONVERGE= option or the MAXITER= option in the PROC ACECLUS statement for more information.
The remaining question of how to choose has no simple answer. In practice, you must try several different values. PROC ACECLUS provides four different ways of specifying :
You can specify a constant value for
. This method is useful if the initial estimate of is quite good. See the ABSOLUTE option and the THRESHOLD= option in the PROC ACECLUS statement for more information. You can specify a threshold value
 that is multiplied by the root mean square distance between observations in the current metric on each iteration to give . Thus, the value of changes from iteration to iteration. This method is appropriate if the initial estimate of is poor. See the THRESHOLD= option in the PROC ACECLUS statement for more information.
 You can specify a value
 ,
,  , to be transformed into a distance such that approximately a proportion of the pairwise Mahalanobis distances between observations in a random sample from a multivariate normal distribution will be less than in repeated sampling. The transformation can be computed only if the number of observations exceeds the number of variables, preferably by at least 10 percent. This method also requires a good initial estimate of . See the PROPORTION= option and the ABSOLUTE option in the PROC ACECLUS statement for more information.
 You can specify a value
, , to be transformed into a value  that is then multiplied by
  times the root mean square distance between observations in the current metric on each iteration to yield . The value of changes from iteration to iteration. This method can be used with a poor initial estimate of . See the PROPORTION= option in the PROC ACECLUS statement for more information.
In most cases, the analysis should begin with the last method, using values of between 0.5 and 0.01 and using the full covariance matrix as the initial estimate of .
Proportions are transformed to distances by using the formula
 |
where  is the quantile (inverse cumulative distribution) function of an
  random variable with and
  degrees of freedom. The squared Mahalanobis distance between a single pair of observations sampled from a multivariate normal distribution is distributed as
  times an random variable with and degrees of freedom. The distances between two pairs of observations are correlated if the pairs have an observation in common. The quantile function is raised to the power given in the preceding formula to compensate approximately for the correlations among distances between pairs of observations that share a member. Monte Carlo studies indicate that the approximation is acceptable if the number of observations exceeds the number of variables by at least 10 percent.
If becomes singular, step 2 in the iterative algorithm cannot be performed because cannot be inverted. In this case, let be the matrix as defined in discussing the convergence measure, and let  , where
  and
and  is diagonal. Let
  be a diagonal matrix, where
 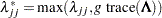 , and
, and  is a user-specified singularity criterion (see the SINGULAR= option in the PROC ACECLUS statement for more information). Then is computed as
  .
.
The ACECLUS procedure differs from the method used by Art, Gnanadesikan, and Kettenring (1982) in several respects:
The Art, Gnanadesikan, and Kettenring method uses the identity matrix as the initial estimate, whereas the ACECLUS procedure enables you to specify any symmetric matrix as the initial estimate and defaults to the total-sample covariance matrix. The default initial estimate in PROC ACECLUS is chosen to yield invariance under nonsingular linear transformations of the data but might sometimes obscure clusters that become apparent if the identity matrix is used.
The Art, Gnanadesikan, and Kettenring method carries out all computations with SSCP matrices, whereas the ACECLUS procedure uses estimated covariance matrices because covariances are easier to interpret than crossproducts.
The Art, Gnanadesikan, and Kettenring method uses the
 pairs with the smallest distances to form the new estimate at each iteration, where is specified by the user, whereas the ACECLUS procedure uses all pairs closer than a given cutoff value. Kettenring (1984) says that the -closest-pairs method seems to give the user more direct control. PROC ACECLUS uses a distance cutoff because it yields a slight decrease in computer time and because in some cases, such as widely separated spherical clusters, the results are less sensitive to the choice of distance cutoff than to the choice of . Much research remains to be done on this issue.
 The Art, Gnanadesikan, and Kettenring method uses a different convergence measure. Let
be computed on each iteration by using the -closest-pairs method, and let  , where
  is the identity matrix. The convergence measure is equivalent to trace
 .
.
Analyses of the Fisher (1936) iris data, consisting of measurements of petal and sepal length and width for 50 specimens from each of three iris species, are summarized in Table 22.1. The number of misclassified observations out of 150 is given for four clustering methods:
 -means as implemented in PROC FASTCLUS with MAXC=3, MAXITER=99, and CONV=0
 Ward’s minimum variance method as implemented in PROC CLUSTER
average linkage on Euclidean distances as implemented in PROC CLUSTER
the centroid method as implemented in PROC CLUSTER
Each hierarchical analysis is followed by the TREE procedure with NCL=3 to determine cluster assignments at the three-cluster level. Clusters with 20 or fewer observations are discarded by using the DOCK=20 option. The observations in a discarded cluster are considered unclassified.
Each method is applied to the following data:
the raw data
the data standardized to unit variance by the STANDARD procedure
two standardized principal components accounting for 95 percent of the standardized variance and having an identity total-sample covariance matrix, computed by the PRINCOMP procedure with the STD option
four standardized principal components having an identity total-sample covariance matrix, computed by PROC PRINCOMP with the STD option
the data transformed by PROC ACECLUS, using seven different settings of the PROPORTION= (P=) option
four canonical variables having an identity pooled within-species covariance matrix, computed using the CANDISC procedure
Theoretically, the best results should be obtained by using the canonical variables from PROC CANDISC. PROC ACECLUS yields results comparable to those from PROC CANDISC for values of the PROPORTION= option ranging from 0.005 to 0.02. At PROPORTION=0.04, average linkage and the centroid method show some deterioration, but -means and Ward’s method continue to produce excellent classifications. At larger values of the PROPORTION= option, all methods perform poorly, although no worse than with four standardized principal components.
Clustering Method |
||||
|---|---|---|---|---|
Data |
|
Ward’s |
Average Linkage |
Centroid |
raw data |
|
|
|
|
standardized data |
25 |
26 |
33+4 |
33+4 |
two standardized principal components |
29 |
31 |
30+9 |
27+32 |
four standardized principal components |
39 |
27 |
32+7 |
45+11 |
transformed by ACECLUS P=0.32 |
39 |
10+9 |
7+25 |
|
transformed by ACECLUS P=0.16 |
39 |
18+9 |
7+19 |
7+26 |
transformed by ACECLUS P=0.08 |
19 |
9 |
3+13 |
5+16 |
transformed by ACECLUS P=0.04 |
4 |
5 |
1+19 |
3+12 |
transformed by ACECLUS P=0.02 |
4 |
3 |
3 |
3 |
transformed by ACECLUS P=0.01 |
4 |
4 |
3 |
4 |
transformed by ACECLUS P=0.005 |
4 |
4 |
4 |
4 |
canonical variables |
3 |
5 |
4 |
4+1 |
|
||||
|
||||
observations; the second is the number of unclassified observations. |
||||


 A single number represents misclassified observations with no unclassified observations.
  Where two numbers are separated by a plus sign, the first is the number of misclassified
 This example demonstrates the following:
PROC ACECLUS can produce results as good as those from the optimal transformation.
PROC ACECLUS can be useful even when the within-cluster covariance matrices are moderately heterogeneous.
The choice of the distance cutoff as specified by the PROPORTION= or the THRESHOLD= option is important, and several values should be tried.
Commonly used transformations such as standardization and principal components can produce poor classifications.
Although experience with the Art, Gnanadesikan, and Kettenring and PROC ACECLUS methods is limited, the results so far suggest that these methods help considerably more often than they hinder the subsequent cluster analysis, especially with normal-mixture techniques such as -means and Ward’s minimum variance method.
Copyright © SAS Institute, Inc. All Rights Reserved.