| The SURVEYFREQ Procedure |
Wald Chi-Square Test
PROC SURVEYFREQ provides two Wald chi-square tests for independence of the row and column variables in a two-way table: a Wald chi-square test based on the difference between observed and expected weighted cell frequencies, and a Wald log-linear chi-square test based on the log odds ratios. These statistics test for independence of the row and column variables in two-way tables, taking into account the complex survey design. See Bedrick (1983), Koch, Freeman, and Freeman (1975), and Wald (1943) for information about Wald statistics and their applications to categorical data analysis.
For these two tests, PROC SURVEYFREQ computes the generalized Wald chi-square statistic, the corresponding Wald  statistic, and also an adjusted Wald statistic for tables larger than
  . Under the null hypothesis of independence, the Wald chi-square statistic approximately follows a chi-square distribution with
  degrees of freedom for large samples. However, it has been shown that this test can perform poorly in terms of actual significance level and power, especially for tables with a large number of cells or for samples with a relatively small number of clusters. See Thomas and Rao (1984 and 1985) and Lohr (1999) for more information. See Felligi (1980) and Hidiroglou, Fuller, and Hickman (1980) for information about the adjusted Wald statistic. Thomas and Rao (1984) found that the adjusted Wald statistic provides a more stable test than the chi-square statistic, although its power can be low when the number of sample clusters is not large. See also Korn and Graubard (1990) and Thomas, Singh, and Roberts (1996).
If you specify the WCHISQ option in the TABLES statement, PROC SURVEYFREQ computes a Wald test for independence in the two-way table based on the differences between the observed (weighted) cell frequencies and the expected frequencies.
Under the null hypothesis of independence of the row and column variables, the expected cell frequencies are computed as
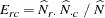 |
where  is the estimated total for row
  ,
,  is the estimated total for column
  , and
, and  is the estimated overall total, as described in the section Expected Weighted Frequency. The null hypothesis that the population weighted frequencies equal the expected frequencies can be expressed as
 |
for all  and
and  . This null hypothesis can be stated equivalently in terms of cell proportions, with the expected cell proportions computed as the products of the marginal row and column proportions.
The generalized Wald chi-square statistic  is computed as
 |
where  is the
  array of differences between the observed and expected weighted frequencies
  , and
, and  estimates the variance of .
 is the covariance matrix of the estimates
  , and its computation is described in the section Covariance of Totals.
 is an by
  matrix containing the partial derivatives of the elements of with respect to the elements of
  . The elements of are computed as follows, where
  denotes a row different from row , and
  denotes a column different from column
  :
:
 |
 |
 |
|||
 |
|
 |
|||
 |
|
 |
|||
 |
|
 |
Under the null hypothesis of independence, the statistic approximately follows a chi-square distribution with degrees of freedom for large samples.
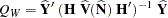
PROC SURVEYFREQ computes the Wald statistic as
 |
Under the null hypothesis of independence,  approximately follows an distribution with numerator degrees of freedom. The denominator degrees of freedom are the degrees of freedom for the variance estimator and depend on the sample design and the variance estimation method. The section Degrees of Freedom describes the computation of the denominator degrees of freedom. Alternatively, you can specify the denominator degrees of freedom with the DF= option in the TABLES statement.
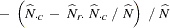
For tables larger than , PROC SURVEYFREQ also computes the adjusted Wald statistic as
 |
where 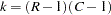 , and
, and  is the degrees of freedom, which are computed as described in the section Degrees of Freedom. Alternatively, you can specify the value of with the DF= option in the TABLES statement. Note that for tables,
  , so the adjusted Wald statistic equals the (unadjusted) Wald statistic, with the same numerator and denominator degrees of freedom.
Under the null hypothesis,  approximately follows an distribution with
  numerator degrees of freedom and
  denominator degrees of freedom.
Copyright © 2009 by SAS Institute Inc., Cary, NC, USA. All rights reserved.