| The POWER Procedure |
Choosing Key (Legend) Styles
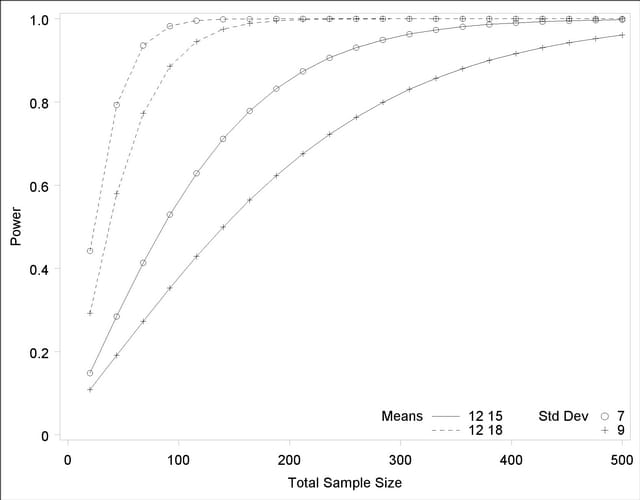
The default style for the key (or "legend") is one that displays the association between levels of features and levels of analysis parameters, located below the X axis. For example, Output 67.8.5 demonstrates this style of key.
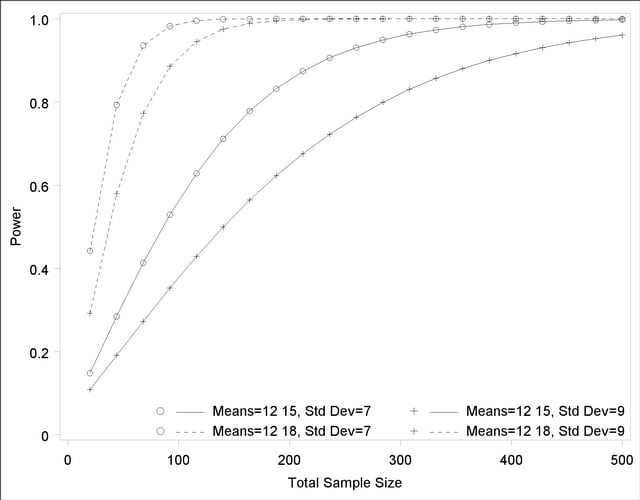
You can reproduce Output 67.8.5 with the same key but a different location, inside the plotting region, by using the POS=INSET option within the KEY=BYFEATURE option in the PLOT statement. The following statements product the plot in Output 67.8.17:
   proc power plotonly;
      twosamplemeans test=diff
         groupmeans   = 12 | 15 18
         stddev       = 7 9
         power        = .
         ntotal       = 200;
      plot x=n min=20 max=500
         key = byfeature(pos=inset);
   run;
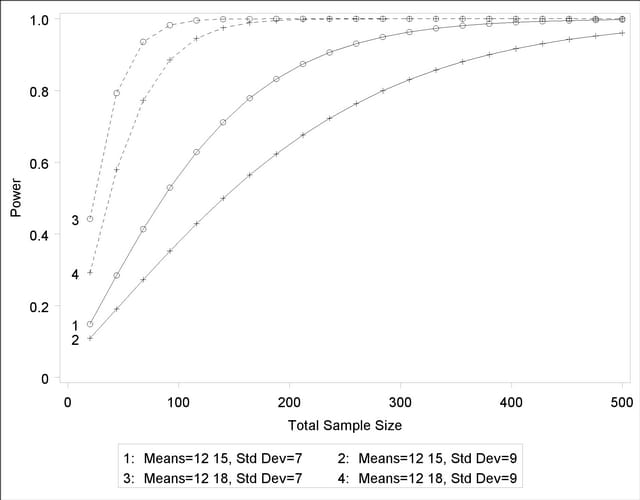
Alternatively, you can specify a key that identifies each individual curve separately by number by using the KEY=BYCURVE option in the PLOT statement:
      plot x=n min=20 max=500
         key = bycurve;
The resulting plot is shown in Output 67.8.18.
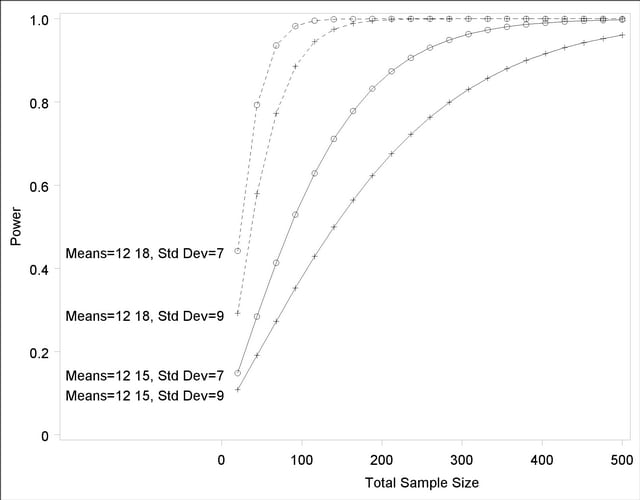
Use the NUMBERS=OFF option within the KEY=BYCURVE option to specify a nonnumbered key that identifies curves with samples of line styles, symbols, and colors:
      plot x=n min=20 max=500
         key = bycurve(numbers=off pos=inset);
The POS=INSET suboption places the key within the plotting region. The resulting plot is shown in Output 67.8.19.
Finally, you can attach labels directly to curves with the KEY=ONCURVES option. The following PLOT statement produces Output 67.8.20:
      plot x=n min=20 max=500
         key = oncurves;
Copyright © 2009 by SAS Institute Inc., Cary, NC, USA. All rights reserved.