| The POWER Procedure |
Adding Reference Lines
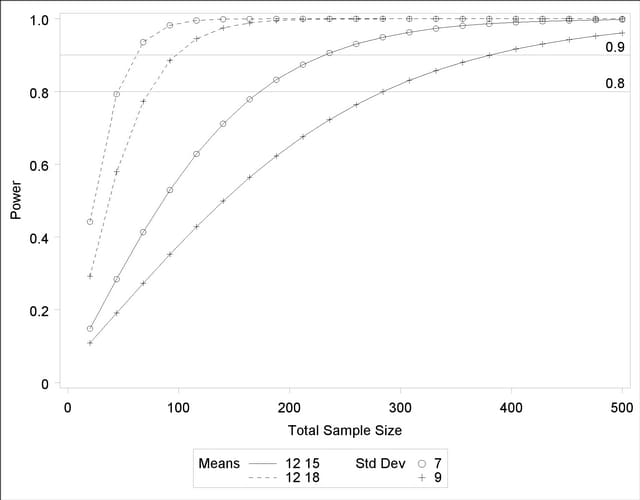
Suppose you want to add reference lines to highlight power=0.8 and power=0.9 on the plot in Output 67.8.5. You can add simple reference lines by using the YOPTS= option and REF= suboption in the PLOT statement to produce Output 67.8.11, with the following statements:
   proc power plotonly;
      twosamplemeans test=diff
         groupmeans   = 12 | 15 18
         stddev       = 7 9
         power        = .
         ntotal       = 100;
      plot x=n min=20 max=500
         yopts=(ref=0.8 0.9);
   run;
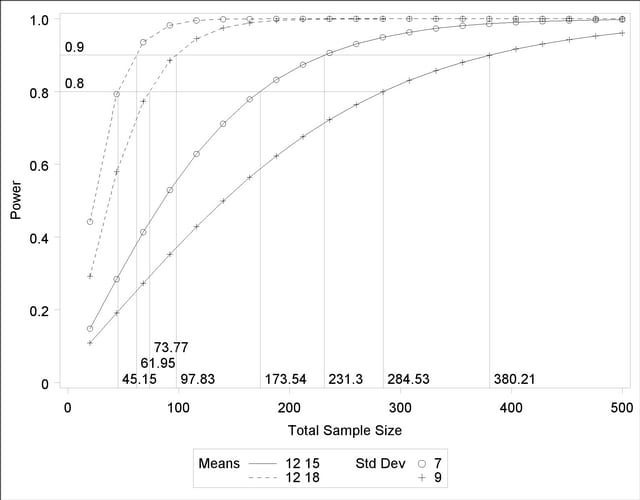
Or you can specify CROSSREF=YES to add reference lines that intersect each curve and cross over to the other axis:
      plot x=n min=20 max=500
         yopts=(ref=0.8 0.9 crossref=yes);
The resulting plot is shown in Output 67.8.12.
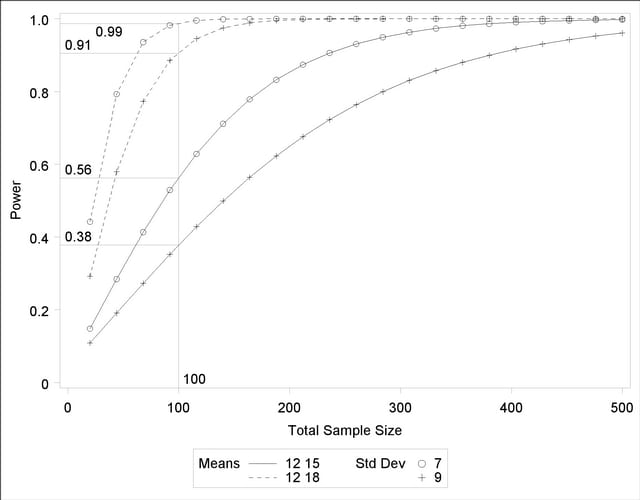
You can also add reference lines for the X axis by using the XOPTS= option instead of the YOPTS= option. For example, the following PLOT statement produces Output 67.8.13, which has crossing reference lines highlighting the sample size of 100:
      plot x=n min=20 max=500
         xopts=(ref=100 crossref=yes);
Copyright © 2009 by SAS Institute Inc., Cary, NC, USA. All rights reserved.