| The PHREG Procedure |
Assessment of the Proportional Hazards Model
The proportional hazards model specifies that the hazard function for the failure time  associated with a
  column covariate vector
  takes the form
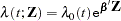 |
where  is an unspecified baseline hazard function and
  is a column vector of regression parameters. Lin, Wei, and Ying (1993) present graphical and numerical methods for model assessment based on the cumulative sums of martingale residuals and their transforms over certain coordinates (such as covariate values or follow-up times). The distributions of these stochastic processes under the assumed model can be approximated by the distributions of certain zero-mean Gaussian processes whose realizations can be generated by simulation. Each observed residual pattern can then be compared, both graphically and numerically, with a number of realizations from the null distribution. Such comparisons enable you to assess objectively whether the observed residual pattern reflects anything beyond random fluctuation. These procedures are useful in determining appropriate functional forms of covariates and assessing the proportional hazards assumption. You use the ASSESS statement to carry out these model-checking procedures.
For a sample of  subjects, let
  be the data of the
  th subject; that is,
  represents the observed failure time,
  has a value of 1 if is an uncensored time and 0 otherwise, and
 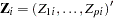 is a
is a  -vector of covariates. Let
  and
and  . Let
. Let
 |
Let  be the maximum partial likelihood estimate of , and let
  be the observed information matrix.
The martingale residuals are defined as
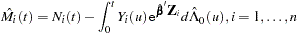 |
where 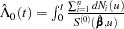 .
.
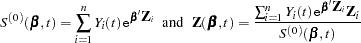
The empirical score process  is a transform of the martingale residuals:
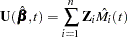 |
Checking the Functional Form of a Covariate
To check the functional form of the  th covariate, consider the partial-sum process of
  :
:
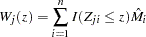 |
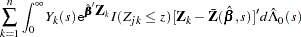
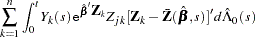
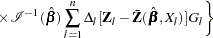
Under that null hypothesis that the model holds,  can be approximated by the zero-mean Gaussian process
 |
 |
 |
|||
 |
|
 |
|||
|
|
 |
where  are independent standard normal variables that are independent of ,
  .
.
You can assess the functional form of the th covariate by plotting a small number of realizations (the default is 20) of  on the same graph as the observed and visually comparing them to see how typical the observed pattern of is of the null distribution samples. You can supplement the graphical inspection method with a Kolmogorov-type supremum test. Let
  be the observed value of
  and let
  . The -value
  is approximated by
  , which in turn is approximated by generating a large number of realizations (1000 is the default) of
  .
.
Checking the Proportional Hazards Assumption
Consider the standardized empirical score process for the th component of
 |
Under the null hypothesis that the model holds,  can be approximated by
 |
 |
 |
|||
|
|
 |
|||
|
|
 |
where  is the th component of
  , and are independent standard normal variables that are independent of
  ,
,  .
.
You can assess the proportional hazards assumption for the th covariate by plotting a few realizations of  on the same graph as the observed and visually comparing them to see how typical the observed pattern of is of the null distribution samples. Again you can supplement the graphical inspection method with a Kolmogorov-type supremum test. Let
  be the observed value of
 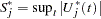 and let
 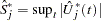 . The -value
  is approximated by
  , which in turn is approximated by generating a large number of realizations (1000 is the default) of
  .
.
Copyright © 2009 by SAS Institute Inc., Cary, NC, USA. All rights reserved.