| Statistical Graphics Using ODS |
Example 21.7 Customizing Panels
This example illustrates how to modify the regression fit diagnostics panel shown in Figure 21.1 so that it displays a subset of the component plots. The original panel consists of eight plots and a summary statistics box. The ODS trace output from PROC REG shown previously shows that the template for the diagnostics panel is Stat.REG.Graphics.DiagnosticsPanel. The following statements display the template:
   proc template;
      source Stat.REG.Graphics.DiagnosticsPanel;
   run;
An abridged version of the results is shown next:
   define statgraph Stat.Reg.Graphics.DiagnosticsPanel;
      notes "Diagnostics Panel";
      dynamic . . .;
      BeginGraph / designheight=defaultDesignWidth;
         entrytitle halign=left textattrs=GRAPHVALUETEXT _MODELLABEL
            halign=center textattrs=GRAPHTITLETEXT "Fit Diagnostics"
            " for " _DEPNAME;
         layout lattice / columns=3 rowgutter=10 columngutter=10
            shrinkfonts=true rows=3;
            layout overlay / xaxisopts=(shortlabel='Predicted');
               . . .
            endlayout;
            layout overlay / xaxisopts=(shortlabel='Predicted');
               . . .
            endlayout;
            layout overlay / xaxisopts=(label='Leverage' offsetmax=0.05)
               . . .
            endlayout;
            layout overlay / yaxisopts=(label="Residual" shortlabel=
               "Resid") xaxisopts=(label="Quantile");
               . . .
            endlayout;
            layout overlayequated / xaxisopts=(shortlabel='Predicted')
               . . .
            endlayout;
            layout overlay / xaxisopts=(linearopts=(integer=true) label=
               "Observation" shortlabel="Obs" offsetmax=0.05) yaxisopts=(
               offsetmin=0.05 offsetmax=0.05);
               . . .
            endlayout;
            layout overlay / xaxisopts=(label="Residual") yaxisopts=(label
               ="Percent");
               . . .
            endlayout;
            layout lattice / columns=2 rows=1 rowdatarange=unionall
               columngutter=0;
               . . .
            endlayout;
            if (_SHOWSTATS =1)
               layout overlay;
               . . .
            endLayout;
            endif;
            if (_SHOWSTATS = 2)
               layout overlay / yaxisopts=(gridDisplay=auto_off label=
               "Residual");
               . . .
            endlayout;
            endif;
         endlayout;
      EndGraph;
   end;
The outermost components of the template are a BEGINGRAPH/ENDGRAPH block with a lattice layout with ROWS=3 and COLUMNS=3 that defines the  panel of plots. Inside that are nine layouts, one for each cell, the last of which is conditionally defined. The LAYOUT statements define the components of the panel from left to right and top to bottom. You can eliminate some of the panels and produce a
  panel as follows:
   proc template;
      define statgraph Stat.Reg.Graphics.DiagnosticsPanel;
         notes "Diagnostics Panel";
         dynamic _DEPLABEL _DEPNAME _MODELLABEL _OUTLEVLABEL _TOTFREQ _NPARM
            _NOBS _OUTCOOKSDLABEL _SHOWSTATS _NSTATSCOLS _DATALABEL _SHOWNObs
            _SHOWTOTFREQ _SHOWNParm _SHOWEDF _SHOWMSE _SHOWRSquare
            _SHOWAdjRSq _SHOWSSE _SHOWDepMean _SHOWCV _SHOWAIC _SHOWBIC
            _SHOWCP _SHOWGMSEP _SHOWJP _SHOWPC _SHOWSBC _SHOWSP _EDF _MSE
            _RSquare _AdjRSq _SSE _DepMean _CV _AIC _BIC _CP _GMSEP _JP _PC
            _SBC _SP;
         BeginGraph / designheight=defaultDesignWidth;
            entrytitle halign=left textattrs=GRAPHVALUETEXT _MODELLABEL
               halign=center textattrs=GRAPHTITLETEXT "Fit Diagnostics"
               " for " _DEPNAME;
            layout lattice / columns=2 rowgutter=10 columngutter=10
               shrinkfonts=true rows=2;
               layout overlay / xaxisopts=(shortlabel='Predicted');
                  referenceline y=-2;
                  referenceline y=2;
                  scatterplot y=RSTUDENT x=PREDICTEDVALUE / primary=true
                     datalabel=_OUTLEVLABEL rolename=(_tip1=OBSERVATION _id1=
                     ID1 _id2=ID2 _id3=ID3 _id4=ID4 _id5=ID5) tip=(y x _tip1
                     _id1 _id2 _id3 _id4 _id5);
               endlayout;
               layout overlay / yaxisopts=(label="Residual" shortlabel=
                  "Resid") xaxisopts=(label="Quantile");
                  lineparm slope=eval (STDDEV(RESIDUAL)) y=eval (
                     MEAN(RESIDUAL)) x=0 / extend=true lineattrs=
                     GRAPHREFERENCE;
                  scatterplot y=eval (SORT(DROPMISSING(RESIDUAL))) x=eval (
                     PROBIT((NUMERATE(SORT(DROPMISSING(RESIDUAL))) -0.375)/
                     (0.25 + N(RESIDUAL)))) / markerattrs=GRAPHDATADEFAULT
                     primary=true
                     rolename=(s=eval (SORT(DROPMISSING(RESIDUAL))) nq=eval (
                     PROBIT((NUMERATE(SORT(DROPMISSING(RESIDUAL))) -0.375)
                     /(0.25 + N(RESIDUAL))))) tiplabel=(nq="Quantile"
                     s="Residual")
                     tip=(nq s);
               endlayout;
               layout overlayequated / xaxisopts=(shortlabel='Predicted')
                  yaxisopts=(label=_DEPLABEL shortlabel="Observed")
                  equatetype=square;
                  lineparm slope=1 x=0 y=0 / extend=true lineattrs=
                     GRAPHREFERENCE;
                  scatterplot y=DEPVAR x=PREDICTEDVALUE / primary=true
                     datalabel=_OUTLEVLABEL rolename=(_tip1=OBSERVATION _id1=
                     ID1 _id2=ID2 _id3=ID3 _id4=ID4 _id5=ID5) tip=(y x _tip1
                     _id1 _id2 _id3 _id4 _id5);
               endlayout;
               layout overlay / xaxisopts=(label="Residual") yaxisopts=(label
                  ="Percent");
                  histogram RESIDUAL / primary=true;
                  densityplot RESIDUAL / name="Normal" legendlabel="Normal"
                     lineattrs=GRAPHFIT;
               endlayout;
            endlayout;
         EndGraph;
      end;
   run;

   proc reg data=sashelp.class;
      model Weight = Height;
   run; quit;
This template plots the residuals by predicted values, the Q-Q plot, the actual by predicted plot, and the residual histogram. The results are shown in Output 21.7.1.
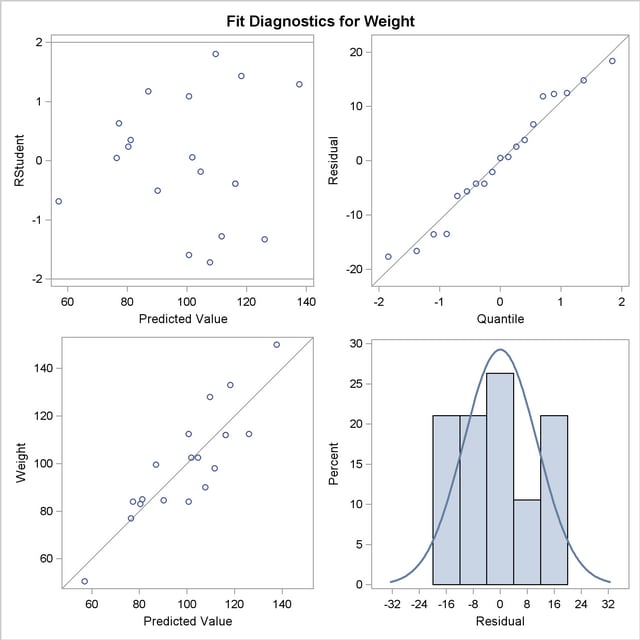
This new template is a straightforward modification of the original template. The COLUMNS=2 and ROWS=2 options in the LAYOUT LATTICE statement request a lattice. The LAYOUT statement blocks for components 1, 3, 6, 8, and 9 are deleted.
Note:You do not need to understand every aspect of a template to modify it if you can recognize the overall structure and a few key options.
You can restore the original template as follows:
   proc template;
      delete Stat.REG.Graphics.DiagnosticsPanel;
   run;
Copyright © 2009 by SAS Institute Inc., Cary, NC, USA. All rights reserved.