| Statistical Graphics Using ODS |
| The SGSCATTER Procedure |
You can use the SGSCATTER procedure to produce scatter plot matrices. The following step creates a scatter plot matrix from all of the numeric variables in the Class data set available in the SASHELP library and produces Figure 21.35:
   proc sgscatter data=sashelp.class;
      matrix _numeric_ / diagonal=(kernel histogram);
   run;
The diagonal cells of Figure 21.35 contain a histogram and a kernel density fit. The off-diagonal cells contain all pairs of scatter plots.
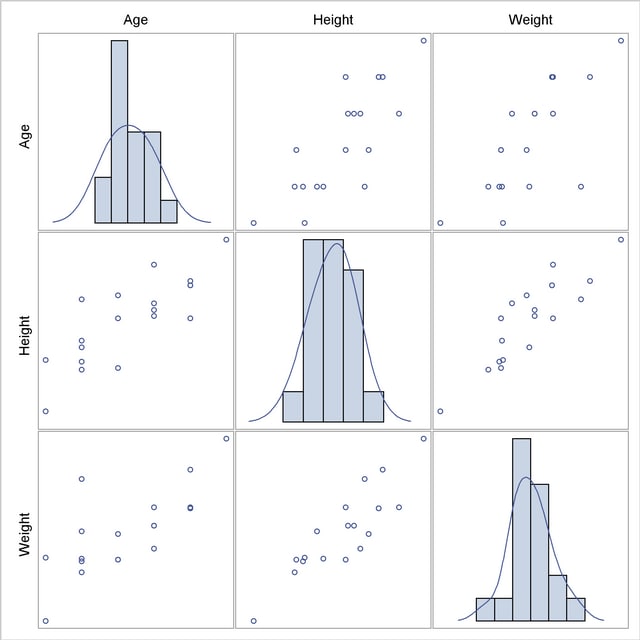
The MATRIX statement creates a symmetric  scatter plot matrix. Other statements are available as well. The PLOT statement creates a panel containing one or more individual scatter plots. The COMPARE statement creates a rectangular
  scatter plot matrix. Linear and nonlinear fits can be added, and many graphical features can be requested with options.
Copyright © 2009 by SAS Institute Inc., Cary, NC, USA. All rights reserved.