| Statistical Graphics Using ODS |
| Displaying Templates |
Once you have found the fully qualified name of a template, you can display its definition (source program) by using one of these methods:
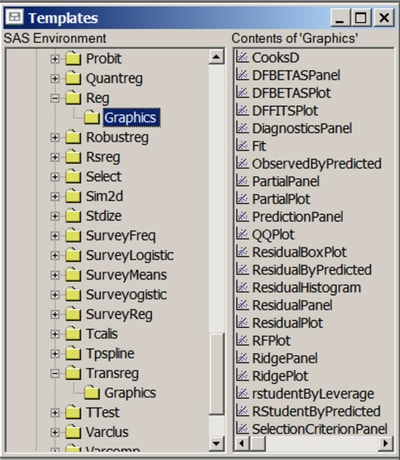
Open the Templates window by issuing the command odstemplates (odst for short) in the command line of the SAS windowing environment. The template window is shown in Figure 21.33. If you expand the SASHELP.Tmplmst node, you can view all the available templates and double-click any template icon to display its definition. This is illustrated in Example 21.5.
Use the SOURCE statement in PROC TEMPLATE to display a template definition in the SAS log or write the definition to a file.

For example, the following statements display the template for the PROC REG residual plot:
   proc template;
      source Stat.REG.Graphics.ResidualPlot;
   run;
The template is displayed as follows:
   define statgraph Stat.Reg.Graphics.ResidualPlot;
      notes "Residual Plot";
      dynamic _XVAR _SHORTXLABEL _TITLE _LOESSLABEL _DEPNAME
              _MODELLABEL _SMOOTH;
      BeginGraph;
         entrytitle halign=left textattrs=GRAPHVALUETEXT
            _MODELLABEL halign=center
            textattrs=GRAPHTITLETEXT _TITLE " for " _DEPNAME;
         entrytitle textattrs=GRAPHVALUETEXT _LOESSLABEL;
         layout overlay / xaxisopts=(shortlabel=_SHORTXLABEL);
            referenceline y=0;
            scatterplot y=RESIDUAL x=_XVAR / primary=true
               rolename=(_tip1=OBSERVATION _id1=ID1 _id2=ID2
               _id3=ID3 _id4=ID4 _id5=ID5) tip=(y x
               _tip1 _id1 _id2 _id3 _id4 _id5);
            if (EXISTS(_SMOOTH))
               loessplot y=_SMOOTH x=_XVAR /
                  tiplabel=(y="Smoothed Residual");
            endif;
         endlayout;
      EndGraph;
   end;
PROC TEMPLATE also tells you where the template is located. In this case, it prints the following note:
NOTE: Path 'Stat.Reg.Graphics.ResidualPlot' is in: SASHELP.TMPLMST.
The word "Path" in ODS refers to any name or label hierarchy. In the note, the levels of the template name form a path. In the trace output, the levels of the plot name form a different path.
Copyright © 2009 by SAS Institute Inc., Cary, NC, USA. All rights reserved.