| Statistical Graphics Using ODS |
| ODS Destinations |
ODS can send your graphs and tables to a number of different destinations including RTF (rich text format), HTML (hypertext markup language), LISTING (the SAS LISTING destination), DOCUMENT (the ODS document), and PDF (portable document format). You use an ODS statement to open a destination, as in the following examples:
   ods html body='b.htm';
   ods rtf;
   ods listing;
   ods document name=MyDoc(write);
   ods pdf file="contour.pdf";
You can close destinations individually or all at once, as in the following examples:
   ods html close;
   ods rtf close;
   ods listing close;
   ods document close;
   ods pdf close;
   ods _all_ close;
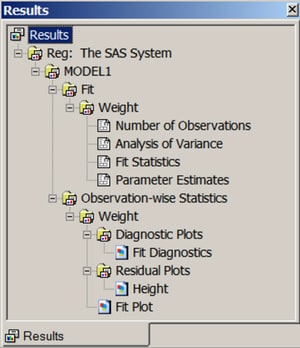
For most ODS destinations (for example, HTML, RTF, and PDF), graphs and tables are integrated in the output, and you view your output with an appropriate viewer, such as a web browser for HTML. However, the default LISTING destination is different. If you are using the LISTING destination in the SAS windowing environment, you view your graphs individually by clicking the graph icons in the Results window, as illustrated in Figure 21.16. This action invokes a host-dependent graph viewer (for example, Microsoft Photo Editor on Windows). The graphs produced with ODS Graphics are not displayed with traditional graphs in the Graph window.
If you are using the SAS windowing environment and you prefer to view integrated output, you should specify a destination such as HTML or RTF. At the same time, you can prevent the Output window from appearing by closing the LISTING destination, as in the following statements:
   ods listing close;
   ods html;
A graph is created for every open destination. When you open a new destination, you should close all destinations that you do not need. Closing destinations makes your jobs run faster and with fewer resources, because fewer graphs are produced.
Copyright © 2009 by SAS Institute Inc., Cary, NC, USA. All rights reserved.