| Using the Output Delivery System |
Example 20.3 Excluding ODS Tables from Display
The following example demonstrates how you can use the ODS EXCLUDE statement to exclude particular tables from ODS destinations. This example also creates a SAS data set from the excluded table and uses it to create a specialized plot.
The data are from Hemmerle and Hartley (1973). The response variable consists of measurements from an oven experiment, and the model contains a fixed effect a and random effects b and a*b. The following statements create the input SAS data set:
   title 'Oven Measurements';

   data hh;
      input a b y @@;
      datalines;
   1 1 237   1 1 254    1 1 246
   1 2 178   1 2 179
   2 1 208   2 1 178    2 1 187
   2 2 146   2 2 145    2 2 141
   3 1 186   3 1 183
   3 2 142   3 2 125    3 2 136
   ;
The following ODS statements are submitted before the analysis, which will be done with the MIXED procedure:
   ods listing close;
   ods html body='mixed.htm' contents='mixedc.htm' frame='mixedf.htm'
            style=statistical;

   ods exclude ParmSearch(persist);
   ods show;
The ODS HTML statement specifies the filenames to contain the output generated from the statements that follow. The ODS EXCLUDE statement excludes the table ParmSearch from display. Although the table is excluded from the displayed output, the information contained in the ParmSearch table is graphically summarized in a later step.
The PERSIST option in the ODS EXCLUDE statement excludes the table for the entire SAS session or until you execute an ODS SELECT statement or an ODS EXCLUDE NONE statement. If you omit the PERSIST option, the exclusion list is cleared when the procedure terminates. The resulting exclusion list is displayed next:
   Current OVERALL exclude list is:
   1. ParmSearch(PERSIST)
The MIXED procedure is run to fit the model:
   proc mixed data=hh;
      class a b;
      model y = a;
      random b a*b;
      parms (17 to 20 by 0.1) (.3 to .4 by .005) (1.0);
      ods output ParmSearch=parms;
   run;

   ods show;
All output from PROC MIXED, except the ParmSearch table, is delivered to the HTML and LISTING destinations. The ODS OUTPUT statement outputs the table ParmSearch to a SAS data set called Parms.
The ODS SHOW statement again displays the overall current exclusion list after PROC MIXED has terminated. The results of the ODS SHOW statement are displayed next:
   Current OVERALL exclude list is:
   1. ParmSearch(PERSIST)
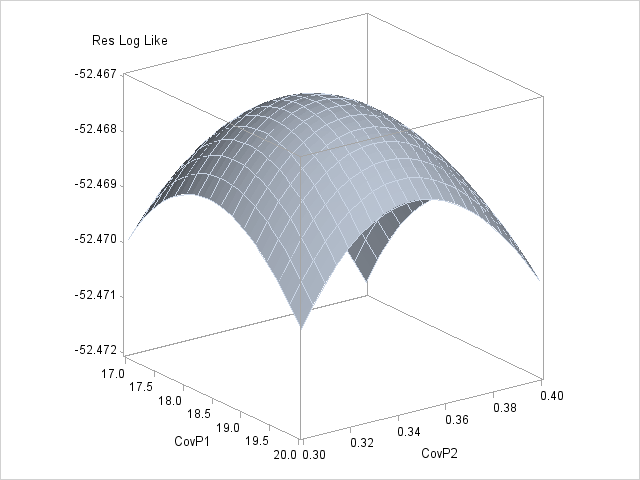
The ParmSearch table is saved in the Parms data set (as specified in the ODS OUTPUT statement). The following steps plot the surface of the residual log likelihood as a function of the covariance parameters and produce Output 20.3.1:
   proc template;
      define statgraph surface;
         begingraph;
            layout overlay3d;
               surfaceplotparm x=CovP1 y=CovP2 z=ResLogLike;
            endlayout;
         endgraph;
      end;
   run;

   proc sgrender data=parms template=surface;
   run;
   ods html close;
PROC TEMPLATE is used to create a template for displaying the data as a three-dimensional surface plot. The plot is displayed with the ODS Graphics procedure SGRENDER. For more information about ODS Graphics, see Chapter 21, Statistical Graphics Using ODS.

Copyright © 2009 by SAS Institute Inc., Cary, NC, USA. All rights reserved.