| Introduction to Clustering Procedures |
| Nonconvex Clusters |
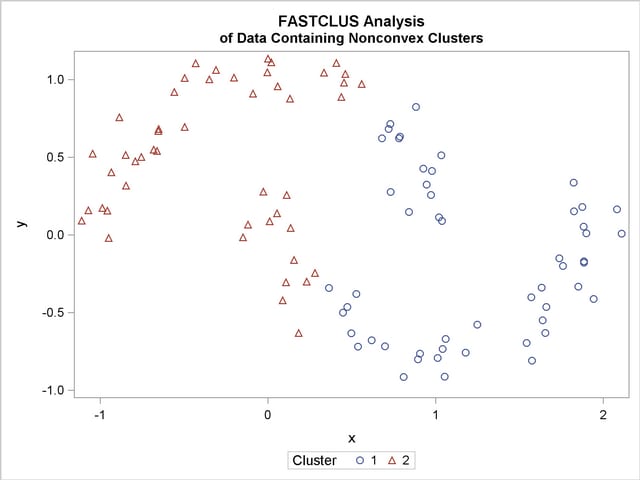
If the population clusters have very different covariance matrices, using PROC ACECLUS is of no avail. Although methods exist for estimating multinormal clusters with unequal covariance matrices (Wolfe 1970; Symons 1981; Everitt and Hand 1981; Titterington, Smith, and Makov 1985; McLachlan and Basford 1988), these methods tend to have serious problems with initialization and might converge to degenerate solutions. For unequal covariance matrices or radically nonnormal distributions, the best approach to cluster analysis is through nonparametric density estimation, as in density linkage. The next example illustrates population clusters with nonconvex density contours. The following SAS statements produce Figure 11.24:
   data noncon;
      keep x y;
      do i=1 to 100;
         a=i*.0628319;
         x=cos(a)+(i>50)+rannor(7)*.1;
         y=sin(a)+(i>50)*.3+rannor(7)*.1;
         output;
      end;
   proc fastclus data=noncon out=out maxc=2 noprint;
   run;

   proc sgplot;
      scatter y=y x=x / group=cluster;
      title 'FASTCLUS Analysis';
      title2 'of Data Containing Nonconvex Clusters';
   run;
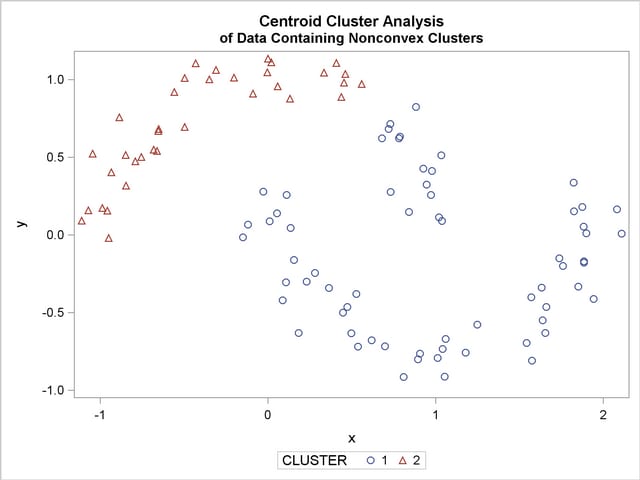
The following SAS statements produce Figure 11.25:
   proc cluster data=noncon outtree=tree
                method=centroid noprint;
   run;

   proc tree noprint out=out n=2 dock=5;
      copy x y;
   run;

   proc sgplot;
      scatter y=y x=x / group=cluster;
      title 'Centroid Cluster Analysis';
      title2 'of Data Containing Nonconvex Clusters';
   run;
The following SAS statements produce Figure 11.26:
   proc cluster data=noncon outtree=tree
                method=twostage k=10 noprint;
   run;

   proc tree noprint out=out n=2;
      copy x y;
   run;

   proc sgplot;
      scatter y=y x=x / group=cluster;
      title 'Two-Stage Density Linkage Cluster Analysis';
      title2 'of Data Containing Nonconvex Clusters';
   run;
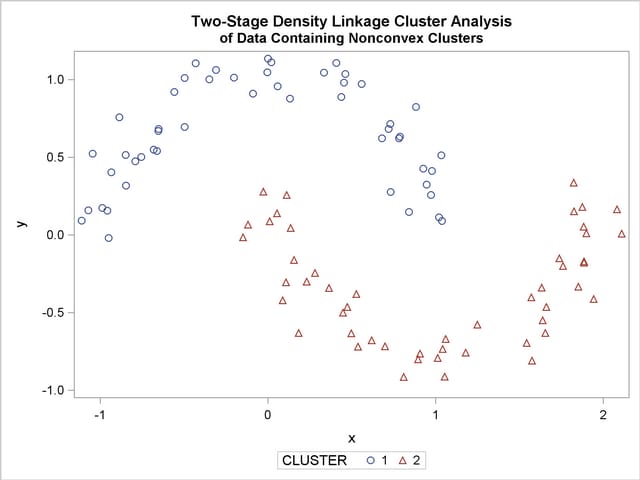
Ward’s method and average linkage (not shown) do better than PROC FASTCLUS but not as well as the centroid method. Two-stage density linkage recovers the correct clusters, as does single linkage (not shown).
The preceding examples are intended merely to illustrate some of the properties of clustering methods in common use. If you intend to perform a cluster analysis, you should consult more systematic and rigorous studies of the properties of clustering methods, such as Milligan (1980).
Copyright © 2009 by SAS Institute Inc., Cary, NC, USA. All rights reserved.