Summarizing Groups of Data
Summary Functions
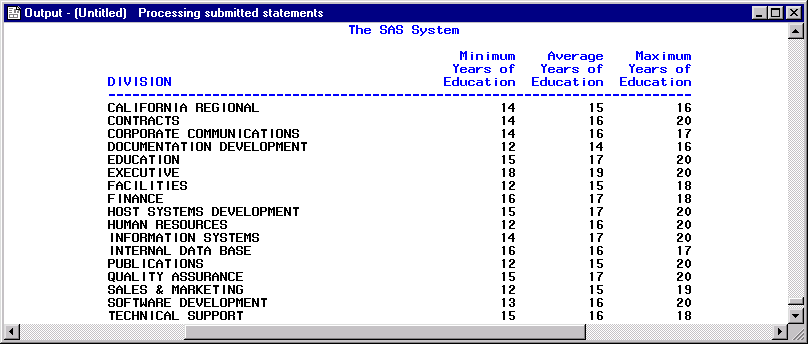
Summary functions produce
a statistical summary of a table or groups of data. The following
example displays the minimum, average, and maximum level of employee
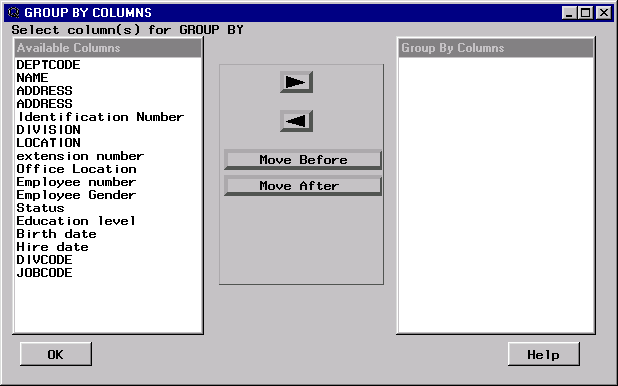
education within each division. Use the Group By clause and a summary
function to summarize information about a group of data. If you omit
a Group By, then one summary value is produced for the entire table.
The Selected Tables list in the SQL QUERY
TABLES window contains SAMPLE.EMPINFO from the previous example. Select OK.
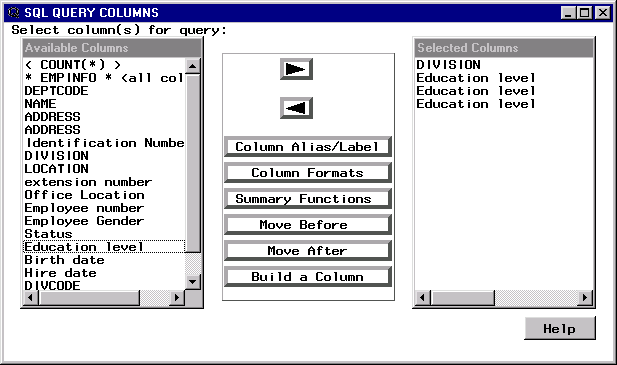
In the SQL
QUERY COLUMNS window, remove COUNT(*) from the Selected Columns list. Select DIVISION and Education level from the Available
Columns list and add them to the Selected Columns list.
Select Education
level a second time from the Available Columns List and
add it to the Selected Columns list.
Select Education
level a third time from the Available Columns list and
add it to the Selected Columns list.
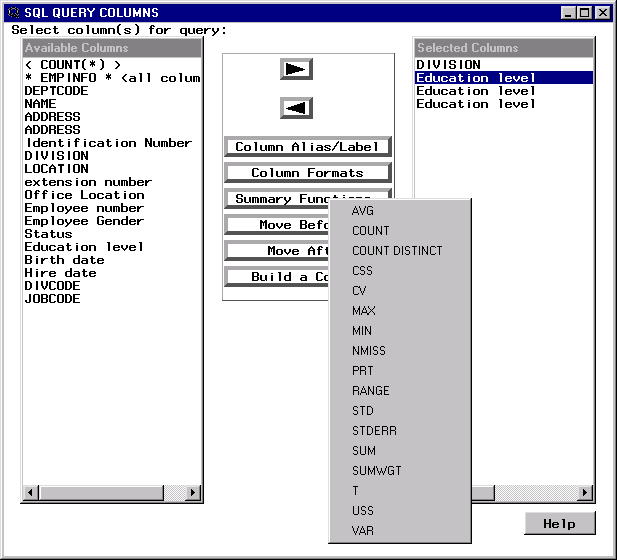
Select MIN from the list of summary functions. A summary function is applied
to the selected column and a default unique column alias is automatically
generated. The summary function and the selected column name are
automatically set as the label. You can use this default label in
the report, or you can set a new alias or label.
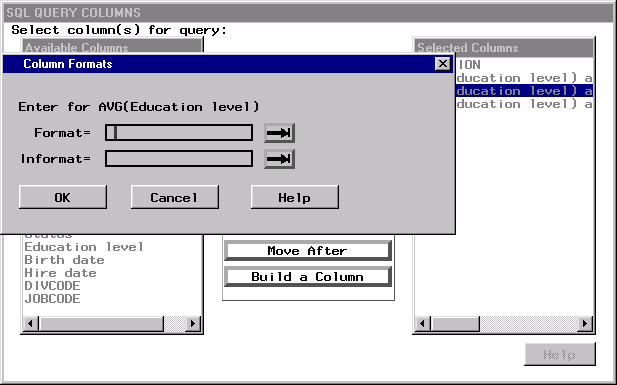
Select the second Education level from the Selected Columns list. Select Summary Functions. Select AVG from the list of summary functions.
Select the third Education level from the Selected Columns list. Select Summary Functions. Select MAX from the list of summary functions.
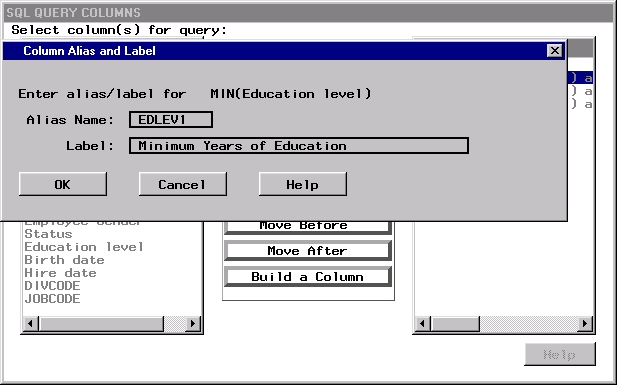
Select the first Education level from the Selected Columns list. Select Column Alias/Label. Type
Minimum Years
                     of Education
in the Label field
of the Column Alias and Label window.
Select the second Education level from the Selected Columns list. Select Column Alias/Label. Type
Average Years
                     of Education
in the Label field
of the Column Alias and Label window.
Group By Columns
Removing Duplicate Rows
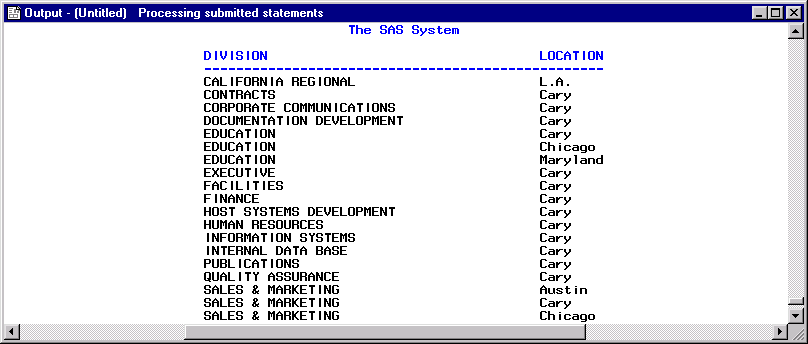
You can remove duplicate rows
from your query output. To display each distinct division and location,
select SAMPLE.EMPINFO and add it to the Selected
Tables list. Select OK.
In the SQL
QUERY COLUMNS window, select DIVISION and LOCATION and add them to the Selected
Columns list.