Creating a Summary Report
Background Information
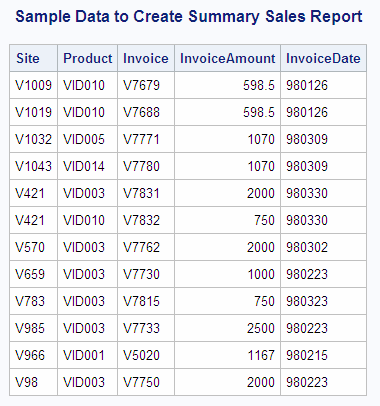
There is one input table,
called SALES, that contains detailed sales information. There is one
record for each sale for the first quarter that shows the site, product,
invoice number, invoice amount, and invoice date.
data sales;
  input Site $ Product $ Invoice $ InvoiceAmount InvoiceDate $;
  datalines;
V1009  VID010  V7679 598.5  980126
V1019  VID010  V7688 598.5  980126
V1032  VID005  V7771  1070  980309
V1043  VID014  V7780  1070  980309
V421   VID003  V7831  2000  980330
V421   VID010  V7832   750  980330
V570   VID003  V7762  2000  980302
V659   VID003  V7730  1000  980223
V783   VID003  V7815   750  980323
V985   VID003  V7733  2500  980223
V966   VID001  V5020  1167  980215
V98    VID003  V7750  2000  980223
;
Solution
Use the following PROC
SQL code to create a column for each month of the quarter, and use
the summary function SUM in combination with the GROUP BY statement
to accumulate the monthly sales for each product:
proc sql;
   title 'First Quarter Sales by Product';
   select Product,
          sum(Jan) label='Jan',
          sum(Feb) label='Feb',
          sum(Mar) label='Mar'
      from (select Product,
                   case
                      when substr(InvoiceDate,3,2)='01' then
                         InvoiceAmount end as Jan,
                   case
                      when substr(InvoiceDate,3,2)='02' then
                         InvoiceAmount end as Feb,
                   case
                      when substr(InvoiceDate,3,2)='03' then
                         InvoiceAmount end as Mar
               from work.sales)
      group by Product;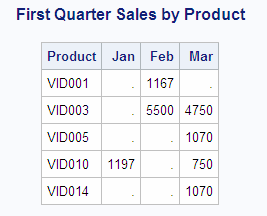
How It Works
This solution uses an
in-line view to create three temporary columns, Jan, Feb, and Mar,
based on the month part of the invoice date column. The in-line view
is a query that performs the following:
The first, or outer, SELECT statement in the query
performs the following:
-
uses a CASE expression to assign the value of invoice amount to one of three columns, Jan, Feb, or Mar, depending on the value of the month part of the invoice date column
case
   when substr(InvoiceDate,3,2)='01' then
      InvoiceAmount end as Jan,
case
   when substr(InvoiceSate,3,2)='02' then
      InvoiceAmount end as Feb,
case
   when substr(InvoiceDate,3,2)='03' then
      InvoiceAmount end as Mar
Copyright © SAS Institute Inc. All rights reserved.