Design of Experiments
Analyze the Simulated Results
From the results in Figure C.9, design point 6 (which represents three workers at quality control, one worker at the repair desk, and two workers at the service desk) seems to satisfy the goal of reducing the bottleneck at the quality control station while providing a reasonable balance between the waiting time and the utilization at all three stations. However, you can also use the JMP software to conduct a more formal statistical analysis of the results. For example, you can estimate a statistical model (or metamodel) that can be used for prediction purposes.
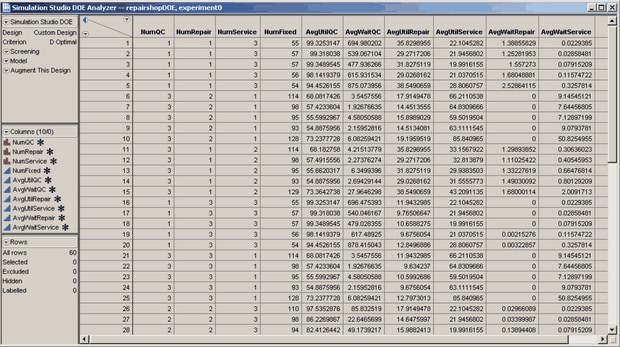
To pass the simulated results in the Experiment window back to the JMP GUI, right-click in the Experiment window (be sure the Reset button has been pushed) and select the Analyze Results option. This automatically creates a JMP data table with the results for all replications of all the design points. The Experiment window must include at least one factor and one response in order to use the Analyze Results option. Note that the JMP table for this experiment has 60 rows, one for each of the five replicates for each design point. See Figure C.11.
To fit a model to the results, click Model and then Run Script in the JMP Simulation Studio DOE Analyzer window to open the Model Specification window. See the JMP documentation for specific details about how to estimate models.
Figure C.11: JMP Simulation Studio DOE Analyzer Window
From the JMP Simulation Studio DOE Analyzer window, you can also choose to augment the design. Select the Run Script option from the Augment This Design menu (in the upper left corner of Figure C.11) to open the JMP Augment Design window. See Figure C.12. See the JMP documentation for details about using the JMP augment design feature. If you make any changes in the Augment Design window, you can click Commit to pass the augmented design back to Simulation Studio. Figure C.13 shows the Experiment window in Simulation Studio after selecting the JMP default augmented design. Six design points are added, and one replication is added to design point 2.
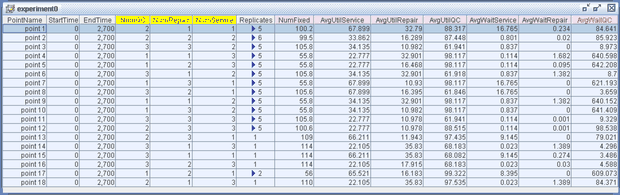
You can run the new design points by highlighting all rows in the Experiment window and then clicking Augment on the Run menu or the Augment icon on the toolbar. Only points with new or additional replications (such as point 2) are run. For example, one additional run of point 2 is made, and then the new points 13–18 are run. Notice that the design points in the Experiment window might now be in a different order than they were before augmenting the design. For example, design point 1 in Figure C.10 is now design point 4 in Figure C.13, but the results are the same.
Figure C.12: JMP Augment Design Window
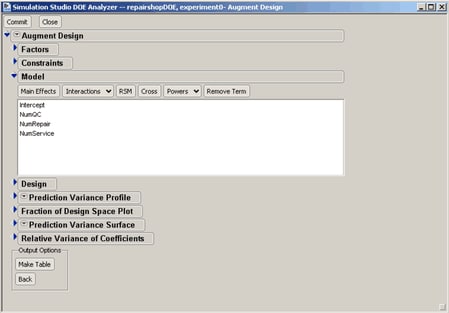
Figure C.13: Experiment Window after Using the JMP Augment Design Feature