Design of Experiments
Run the Experiment
To run the experiment in Simulation Studio, highlight all the rows in the table by holding down the left mouse button on the first design point and dragging the mouse to highlight all the remaining design points. Now click the Play icon on the toolbar to run all replications of all the design points.
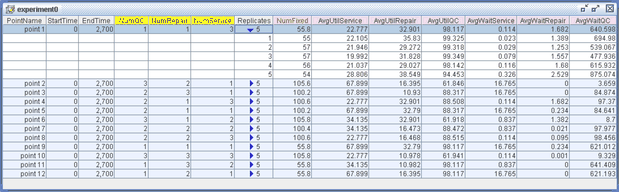
Figure C.9 shows the Experiment window after running all 12 design points. By default, the value reported for each response is the average over all five replications. To view the minimum or maximum value over all replications, right-click in the column header for a response and select Summary. The resulting dialog box enables you to display the average, minimum, or maximum value for the selected response. You can view the individual response values for each of the five replications for each design point by clicking the blue arrow next to the number of replications within a design point. Figure C.10 shows the five replications for design point 1. To hide the replication results, click the blue arrow again.
Figure C.9: Experiment Window Showing Simulated Results
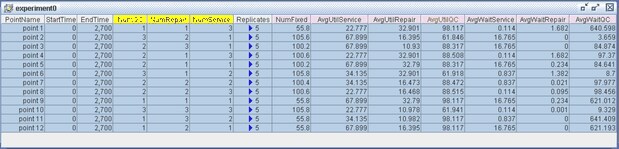
Figure C.10: Experiment Window Showing Results for All Five Replications of Design Point 1