Trace Tab
Trace messages provide details about state changes, events, and execution flow within individual blocks; they are useful for debugging or tuning your simulation models. The Tracer must be enabled before any trace messages are generated. You can enable the Tracer by using the pop-up menu available on the Trace tab background.
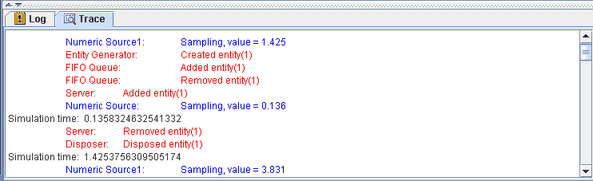
The following types of entries are displayed on the Trace tab:
simulation clock timestamps (displayed in black)
entity information (displayed in red)
value information (displayed in blue)
When the Tracer is enabled, a timestamp is posted to the Trace tab every time the simulation clock advances. All other trace messages are generated by the individual blocks. Each block is responsible for the content of its trace messages and for determining when to generate trace messages.
Although it is possible (and likely) for any simulation model execution to generate a considerable volume of trace messages, the Trace tab has a limited size buffer associated with it to store the messages. Therefore, only the most recent trace messages are retained in the trace buffer after the buffer is full. Figure 10.2 shows a sample Trace tab.