| Multiple Regression |
Collinearity Diagnostics Table
| Choose Tables:Collinearity Diagnostics. |
![[menu]](images/reg_regeq16.gif)
This displays the table shown in Figure 14.7.
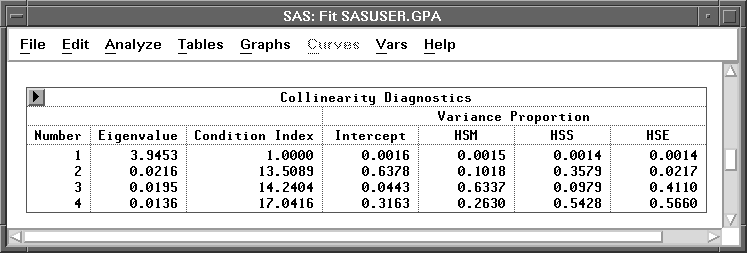
Figure 14.7: Collinearity Diagnostics Table
When an explanatory variable is nearly a linear combination of other explanatory variables in the model, the estimates of the coefficients in the regression model are unstable and have high standard errors. This problem is called collinearity. The Collinearity Diagnostics table is calculated using the eigenstructure of the X'X matrix. See Chapter 13, "Fitting Curves," for a complete explanation.
A collinearity problem exists when a component associated with a high condition index contributes strongly to the variance of two or more variables. The highest condition number in this table is 17.0416. Belsley, Kuh, and Welsch (1980) propose that a condition index of 30 to 100 indicates moderate to strong collinearity.
Copyright © 2007 by SAS Institute Inc., Cary, NC, USA. All rights reserved.