| Poisson Regression |
Parameter Estimates
Analyses where some effects are classification variables yield different parameter estimates from those observed in a regression setting. They represent a different additive contribution for each level value (or combination of level values for interaction effects), and thus the individual elements in the table are not as easily interpretable as they are in multiple regression.
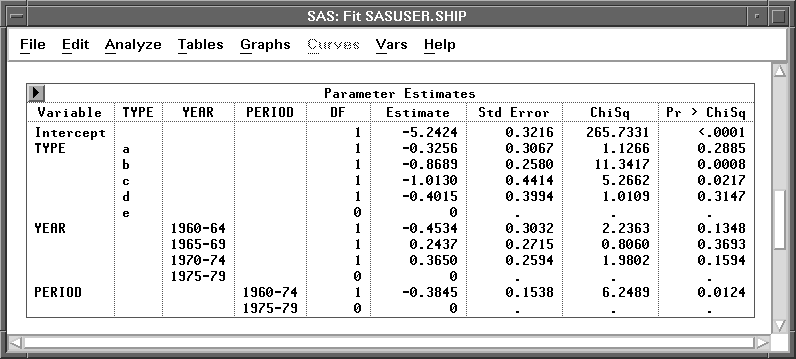
Figure 17.10: Parameter Estimates Table
Because the overall level is set by the INTERCEPT parameter, the set of parameters associated with an effect is redundant. This shows up in the Parameter Estimates table as parameters with degrees of freedom (DF) that are 0 and estimates that are 0. An example of this is the parameter for the e level of the TYPE variable.
From the Parameter Estimates table, ships of types b and c have the lowest risk, and ships of type e the highest. The oldest ships (built between 1960 and 1964) have the lowest risk and ships built between 1965 and 1974 have the highest risk. Ships operated between 1960 to 1974 have a lower risk than ships operated between 1975 to 1979.
The analysis provides a table for the complete fitted model, but you should not use these parameter estimates and their associated statistics individually to determine which parameters have an effect. For further information on parameter estimates and other features of the Fit window, see Chapter 39, "Fit Analyses."
Related Reading |
Generalized Linear Models, Chapter 39. |
Copyright © 2007 by SAS Institute Inc., Cary, NC, USA. All rights reserved.